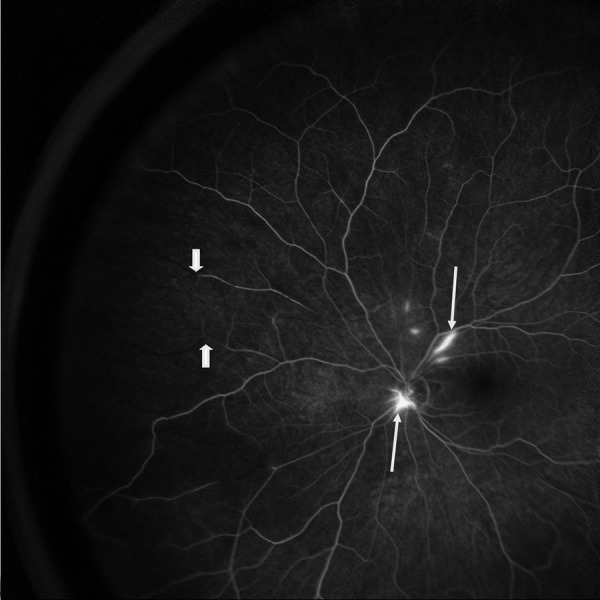
Figure 2.

Flourescein angiogram of the right eye at presentation, note the areas of hyperfluorescense denoting leakage from inflamed retinal arterioles (arrows) and the areas of arteriolar occlusion showing a fluid void due to flourscein not passing beyond the blockage (thick arrows).
