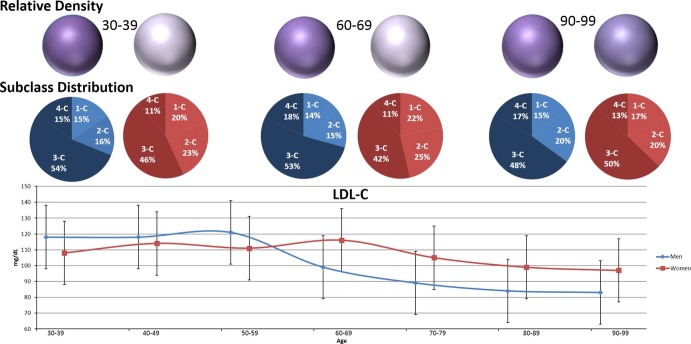
Figure 3.

LDL‐C and density through late life, by sex. Lower panel shows median LDL‐C (directly measured) with interquartile range, by sex through life. Middle panel shows the ratio of dense subclasses (darker) to buoyant subclasses (lighter) at select ages to highlight the pre‐, peri‐, and post‐menopausal time periods. Upper panel shows density relative to men, age 30 to 39. Upper panel shows LLDR or density expressed as color saturation. Darker, or more saturated purple reflects higher LLDR. As shown, while LDL‐C is higher for women than for men from age 60 and beyond, this is driven by a greater proportion of the buoyant subclasses leading to a preservation of the advantageous density phenotype. With advanced age, sex differences in density narrow. LDL‐C indicates low‐density lipoprotein cholesterol; LLDR, logarithmic LDL density ratio.
