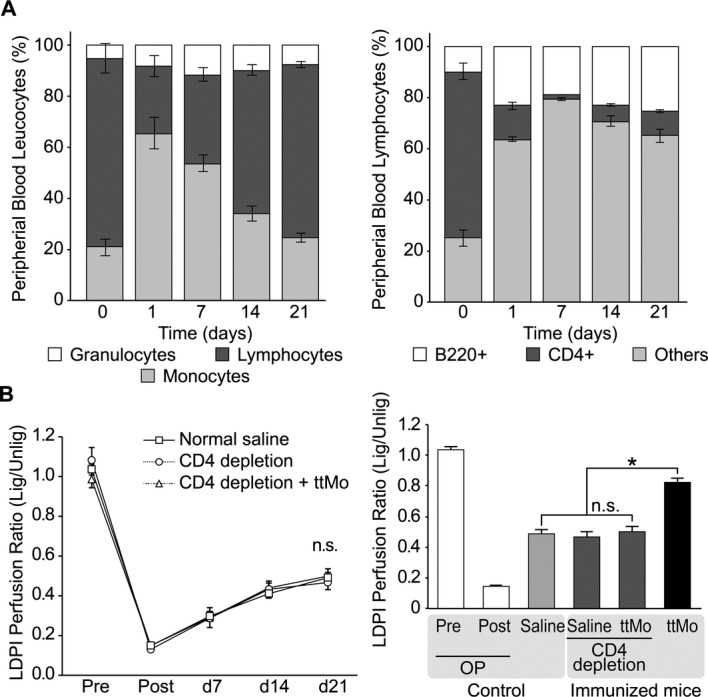
Figure 3.

A, Quantitative analysis of peripheral blood leukocyte concentrations up to 21 days after anti‐CD4 antibody injection. Left panel: peripheral blood leukocytes, P=0.023 for the change in lymphocyte proportions between day 1 and 3 weeks (ANOVA); right panel: sub‐fractionation of lymphocytes into B cells and CD4+ T cells demonstrated the changing proportions from day 1 to 3 weeks (P=0.0021, ANOVA) and the pre‐post effect (P=0.006, paired t test). B, Left panel: kinetics of the LDPI perfusion ratio of pre‐immunized mice (normal saline vs CD4‐depletion vs CD4‐depletion plus ttMo transplantation, P<0.189, ANOVA); right panel: LDPI perfusion ratio 3 weeks after ligation of the femoral artery, the time point of maximal collateralization (P<0.001, t test). The transplantation of ttMo into non‐CD4+ T‐cell‐depleted mice is shown for comparison (black bar). ANOVA indicates analysis of variance; LDPI, laser Doppler perfusion imaging; lig, ligated; ttMo, tetanus toxoid monocytes; Unlig, unligated.
