
Figure 2.
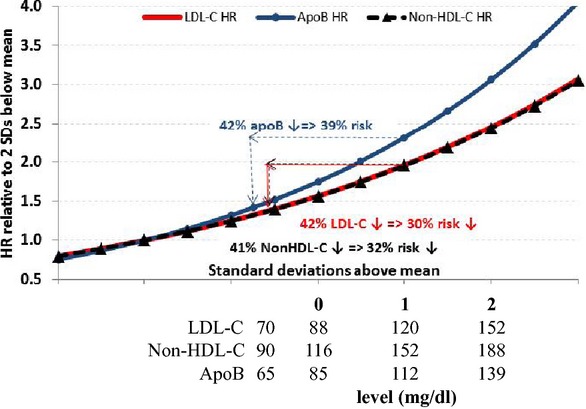
Illustration of the implications of the finding of statistically significant difference in different markers' hazard ratios per standard deviation decrements. The population represented by the gray bell‐shaped curve includes subjects eligible for, and treated under, the 7 placebo‐controlled statin trials. The curves represent the hazard ratios (HRs) relative to 2 standard deviations (SDs) below the mean of this population using the point estimate for each marker's HR per SD (0.799 for LDL‐C, 0.800 for non‐HDL‐C, and 0.756 for apoB). The sample calculations use these parameters to estimate risk reductions if individuals with marker levels 1 SD above the mean are reduced to the 8th NHANES 2005–2010 percentile level: 70 mg/dL for LDL‐C, 65 mg/dL for apoB, and 90 mg/dL for non‐HDL‐C. A, 50 mg/dL (42%) reduction in LDL‐C from 120 to 70 mg/dL would be expected to reduce CHD risk by 30%. Similar decreases to equivalent target levels of non‐HDL‐C and apoB would yield expected risk decreases of 32% and 39%, respectively. CHD indicates coronary heart disease; LDL‐C indicates low‐density lipoprotein cholesterol; HDL‐C, high‐density lipoprotein cholesterol