Figure 1.
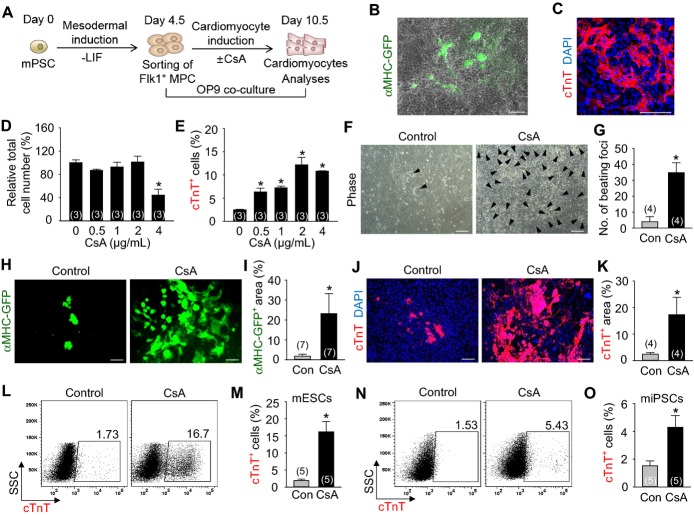
CsA promotes differentiation and expansion of cardiomyocytes from the mouse PSC‐derived Flk1+ MPCs in OP9 co‐culture system. A, Protocol for differentiation of cardiomyocytes in OP9 co‐culture system. B, Live cell image showing αMHC‐GFP+ cardiomyocytes in differentiating Flk1+ MPCs. C, Image showing cTnT+ sarcomeres and DAPI+ nuclei of differentiating Flk1+ MPCs. D, Relative total cell number incubated with indicated concentrations of CsA. Population of total cells without CsA was regarded as 100%. E, Percentage of cTnT+ cardiomyocyte population incubated with indicated concentrations of CsA. F, Phase‐contrast image showing beating cardiomyocyte foci (black arrow head) incubated with control vehicle (Con) and CsA (2 μg/mL). G, Comparison of the number of beating foci generated by control vehicle and CsA. H, Live cell images showing αMHC‐GFP+ cardiomyocytes. I, Percentage of αMHC‐GFP+ area in a live cell image. J, Images showing cTnT+ cardiomyocytes and DAPI+ nuclei. K, Comparison of cTnT+ area (%). L and M, Representative FACS analysis and the percentage of ESC‐derived cTnT+ cardiomyocytes. N and O, Representative FACS analysis and the percentage of iPSC‐derived cTnT+ cardiomyocytes. All scale bars, 100 μm. *P<0.01 vs 0 or Con. CsA indicates cyclosporin A; cTnT, cardiac Troponin T; DAPI, 4,6‐diamidino‐2‐phenylindole; ESC, embryonic stem cell; FACS, fluorescence‐activated cell sorting; GFP, green fluorescent protein; iPSC, induced pluripotent stem cell; LIF, leukemia inhibitory factor; MHC, myosin heavy chain; MPCs, mesodermal precursor cells; SSC, side scatter.

