Figure 3.
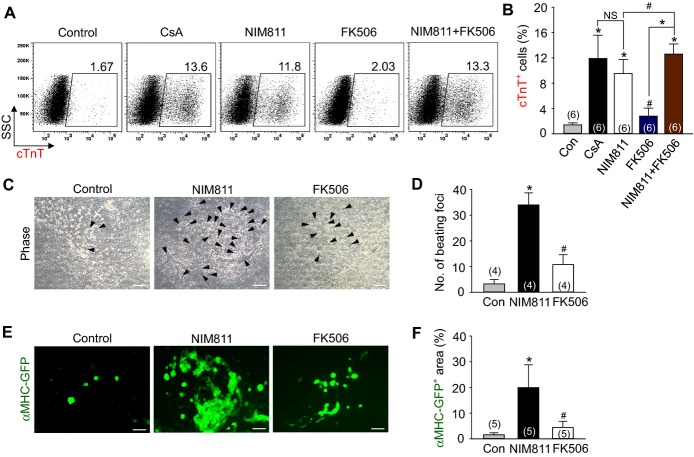
The cardiomyogenic effect of CsA mainly resulted from mPTP inhibition rather than from calcineurin inhibition. A and B, Representative FACS analysis and the percentage of cTnT+ cardiomyocytes incubated with control vehicle (Con), CsA (2 μg/mL), NIM811 (3.6 μg/mL), FK506 (100 ng/mL) and a combination of NIM811 and FK506. C, Phase‐contrast image showing beating cardiomyocyte foci (black arrow head) incubated with Con, NIM811 and FK506. D, Comparison of the number of beating foci. E, Live cell images showing αMHC‐GFP+ cardiomyocytes. F, Percentage of αMHC‐GFP+ area in live cell image. All scale bars, 100 μm. *P<0.01, #P<0.05 and NS (not significant) vs Con or each group. CsA indicates cyclosporin A; cTnT, cardiac Troponin T; GFP, green fluorescent protein; MHC, myosin heavy chain; mPTP, mitochondrial permeability transition pore.

