Figure 4.
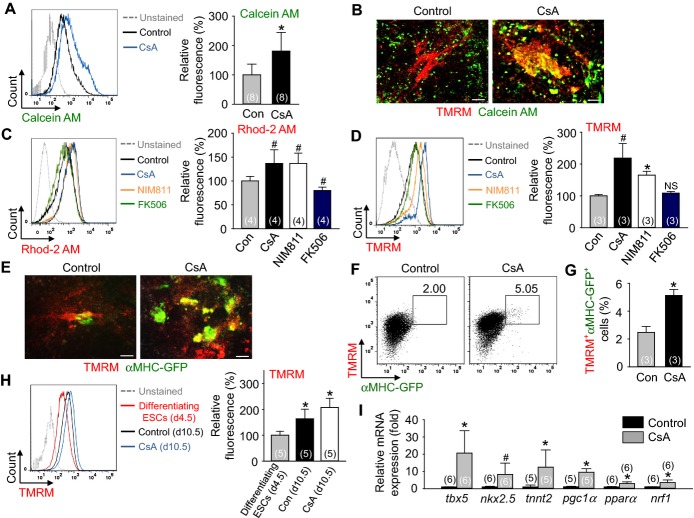
Inhibition of mPTP by CsA directly increases mitochondrial function, which is closely related to cardiomyogenesis. A, Representative FACS analysis of Calcein AM fluorescence intensity and the percentage of relative mean fluorescence intensity of Calcein AM incubated with control vehicle (Con) and CsA (2 μg/mL). B, Live cell images showing TMRM+ and Calcein AM+ cells. C, Representative FACS analysis of Rhod‐2 AM fluorescence intensity and the percentage of relative mean fluorescence intensity of Rhod‐2 AM incubated with Con, CsA (2 μg/mL), NIM811 (3.6 μg/mL) and FK506 (100 ng/mL). D, Representative FACS analysis of TMRM fluorescence intensity and the percentage of relative mean fluorescence intensity of TMRM incubated with Con, CsA, NIM811 and FK506. E, Live cell images showing TMRM+ and αMHC‐GFP+ cells. F and G, Representative FACS analysis and the percentage of TMRM+/αMHC‐GFP+ co‐positive cells. H, Representative FACS analysis of TMRM fluorescence intensity and the percentage of relative mean fluorescence intensity of TMRM in differentiating ESCs at day 4.5 and Flk1+ MPCs incubated with control vehicle and CsA (2 μg/mL) at day 10.5. I, Relative mRNA expression level of cardiomyocyte specific and mitochondrial function related genes in differentiating Flk1+ MPCs. All scale bars, 100 μm. *P<0.01, #P<0.05 and NS (not significant) vs Con or each group. AM indicates acetoxymethyl ester; CsA, cyclosporin A; ESCs, embryonic stem cells; GFP, green fluorescent protein; MHC, myosin heavy chain; MPCs, mesodermal precursor cells; mPTP, mitochondrial permeability transition pore; TMRM, tetramethylrhodamine methyl esters.

