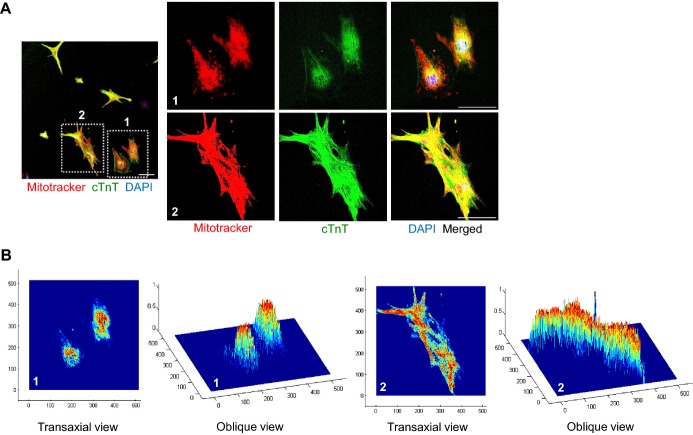
Figure 5.
Mitochondrial development and function are closely related to cardiomyogensis. A, Immunofluorescence images showing Mitotracker+ and cTnT+ cardiomyocytes and DAPI+ nuclei in sorted αMHC‐GFP+ cardiomyocytes at day 11.5. 1 and 2 are magnified views of square‐dotted area in the left side. Scale bar represent 100 μm in the left side and 50 μm in the right side. B, Co‐localized signals of Mitotracker+ and cTnT+ in reconstructed image of (A). cTnT indicates cardiac Troponin T; DAPI, 4,6‐diamidino‐2‐phenylindole; GFP, green fluorescent protein; MHC, myosin heavy chain.

