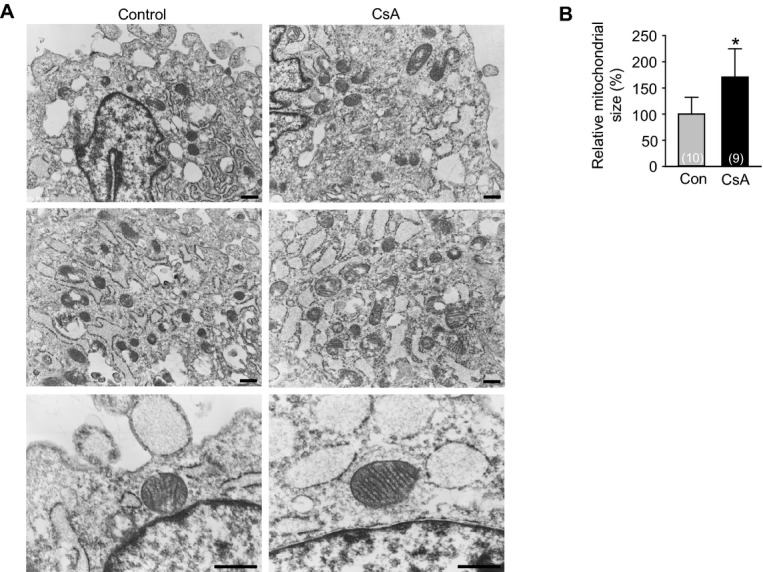
Figure 7.

Inhibition of mPTP directly increases mitochondrial maturation in H9C2 cardiac cell line. A, Electron microscope images showing the mitochondrial morphology and cristae incubated with control vehicle (Con) and CsA (1 μg/mL). Scale bars represent 500 nm. B, Quantification of mitochondrial size in electron microscope images. *P<0.01 vs Con. CsA indicates cyclosporin A; mPTP, mitochondrial permeability transition pore.
