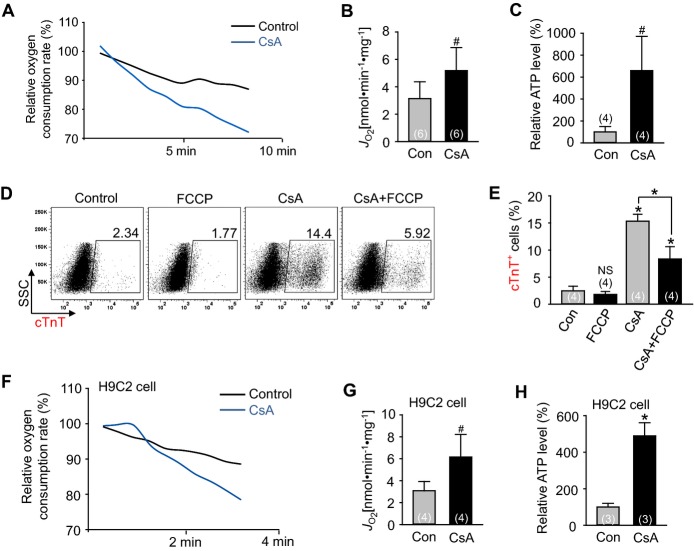
Figure 8.
Activation of mitochondrial oxidative metabolism via mPTP inhibition promotes cardiomyogenesis. A, Representative graph of relative oxygen consumption rate from differentiating Flk1+ MPCs incubated with control vehicle (Con) and CsA (2 μg/mL). B, Quantification of oxygen consumption rate. C, Relative ATP level from differentiating Flk1+ MPCs. D and E, Representative FACS analysis and the percentage of cTnT+ cardiomyocytes incubated with or without CsA and FCCP (3 μmol/L). F, Representative graph of relative oxygen consumption rate in H9C2 cells with control vehicle (Con) and CsA (1 μg/mL). G, Quantification of oxygen consumption rate in H9C2 cells. H, Relative ATP level in H9C2 cells. *P<0.01, #P<0.05 and NS (not significant) vs Con or each group. CsA indicates cyclosporin A; cTnT, cardiac Troponin T; FCCP, carbonyl cyanide‐p‐trifluoromethoxy phenylhydrazone; MPCs, mesodermal precursor cells; mPTP, mitochondrial permeability transition pore.

