
Figure 1.
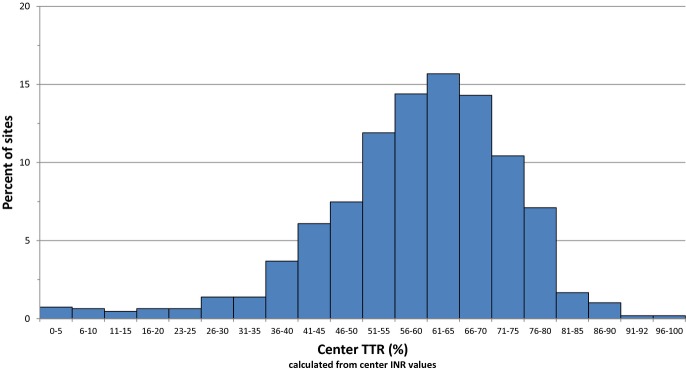
Distribution of cTTR across all sites. This histogram illustrates the distribution of the sites according to cTTR. cTTR indicates center time in therapeutic range; INR, international normalized ratio.
Official websites use .gov
A
.gov website belongs to an official
government organization in the United States.
Secure .gov websites use HTTPS
A lock (
) or https:// means you've safely
connected to the .gov website. Share sensitive
information only on official, secure websites.
Distribution of cTTR across all sites. This histogram illustrates the distribution of the sites according to cTTR. cTTR indicates center time in therapeutic range; INR, international normalized ratio.