
Figure 2.
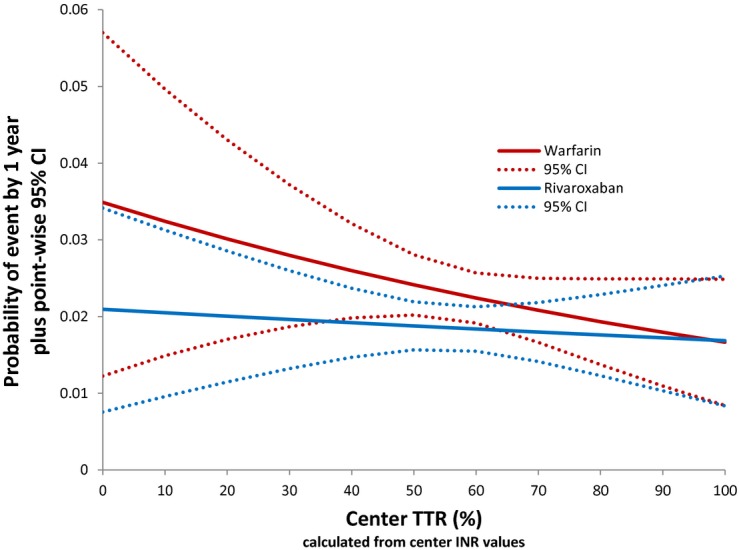
Probability of stroke or non‐CNS embolism in rivaroxaban and warfarin treated patients according to cTTR. cTTR is shown on the x‐axis. Probability of stroke or non‐CNS embolism by 1‐year of follow‐up is shown on the y‐axis. This plot shows the probability of having a stroke or non‐CNS embolism according to cTTR for rivaroxaban‐ and warfarin‐treated patients (solid lines) with corresponding 95% CIs (dashed lines). Centers with higher cTTR values had a lower risk of stroke and systemic embolus in both the rivaroxaban‐ and warfarin‐treated arms. CNS indicates central nervous system; cTTR, center time in therapeutic range; INR, international normalized ratio.