
Figure 3.
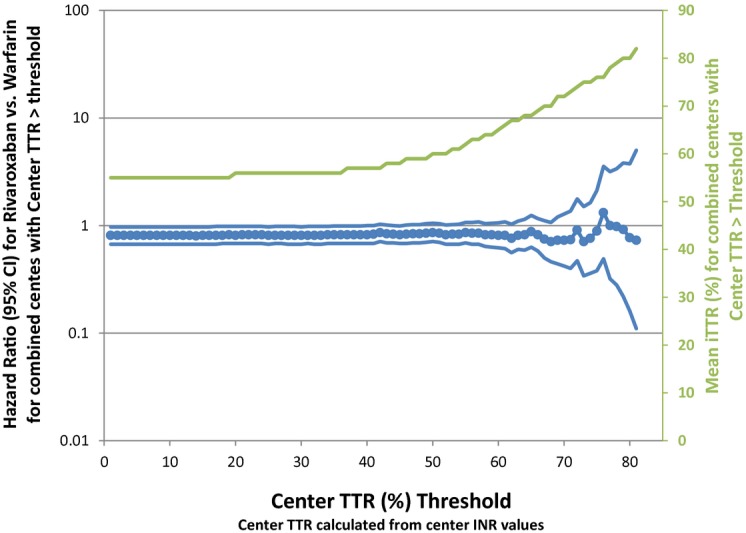
Treatment effect for the reduction of stroke or non‐CNS embolism in rivaroxaban and warfarin treated patients at a given cTTR threshold. The x‐axis shows the threshold value for cTTR and the y‐axis shows the HR for the time to stroke or non‐CNS embolism for rivaroxaban vs warfarin given a certain threshold cTTR. The y‐axis also shows the mean individual TTR in those centers that meet the threshold cTTR. There is instability in the estimate of the treatment effect at high cTTR thresholds due to smaller sample size, but no evidence that warfarin is superior to rivaroxaban in the prevention of stroke and systemic embolus at any cTTR threshold. CNS indicates central nervous system; cTTR, center time in therapeutic range; INR, international normalized ratio.