Figure 2.
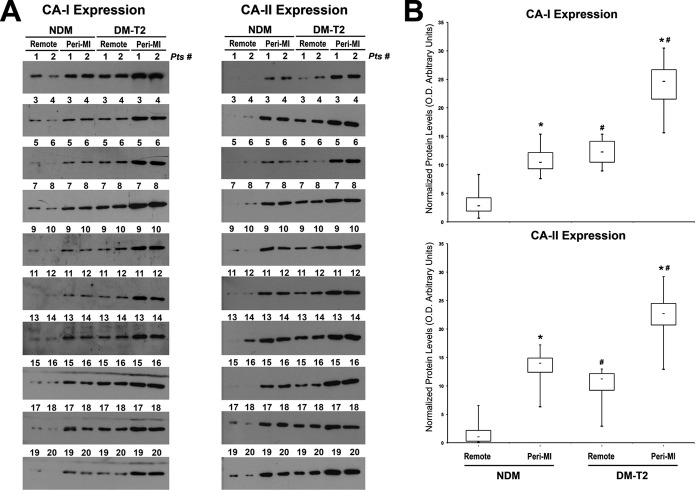
Carbonic anhydrase (CA)‐I and‐II expression in all diabetic and nondiabetic patients included in the study. A, Western blot showing CA‐I and ‐II expression in the remote and peri‐infarct (Peri‐MI) zone of all diabetes mellitus type 2 (DM‐T2) and non–diabetes mellitus (NDM) cardiac samples included in the study. B, Box‐plot graphs showing optical density analysis of CA‐I and ‐II protein levels in DM‐T2 compared with NDM patients; *P<0.0001 vs remote, #P<0.0001 vs NDM, n=20 per group. MI indicates myocardial infarction.

