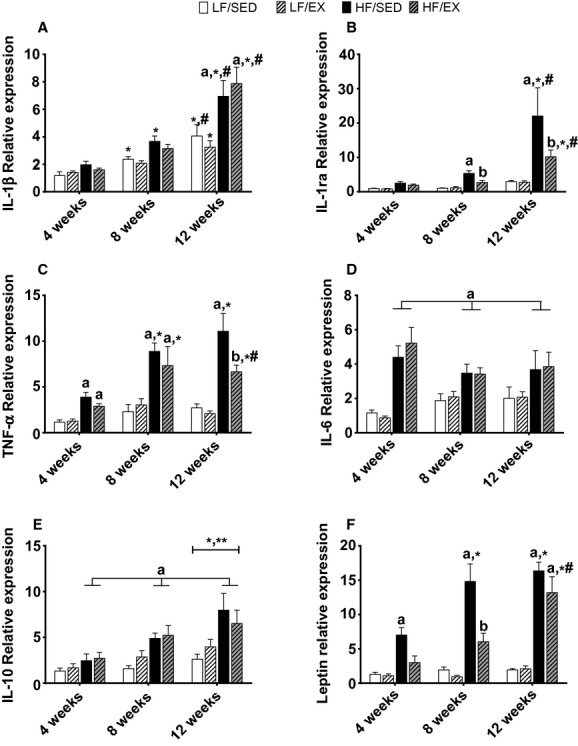
Figure 3.

Gene expression for adipokines within white adipose tissue. Interleukin (IL)‐1β (A), IL‐1 receptor antagonist (IL‐1ra; B), tumor necrosis factor α (TNFα; C), IL‐6 (D), IL‐10 (E), and leptin (F). All values are mean ± standard error of the mean (n = 8–10/group). aSignificantly different from LF‐SED. bSignificant interaction between HF‐feeding groups. *Significantly different from 4 weeks within the treatment group. #Significant difference between 8 and 12 weeks within the treatment group. Significance = P < 0.05.
