
Figure 4.
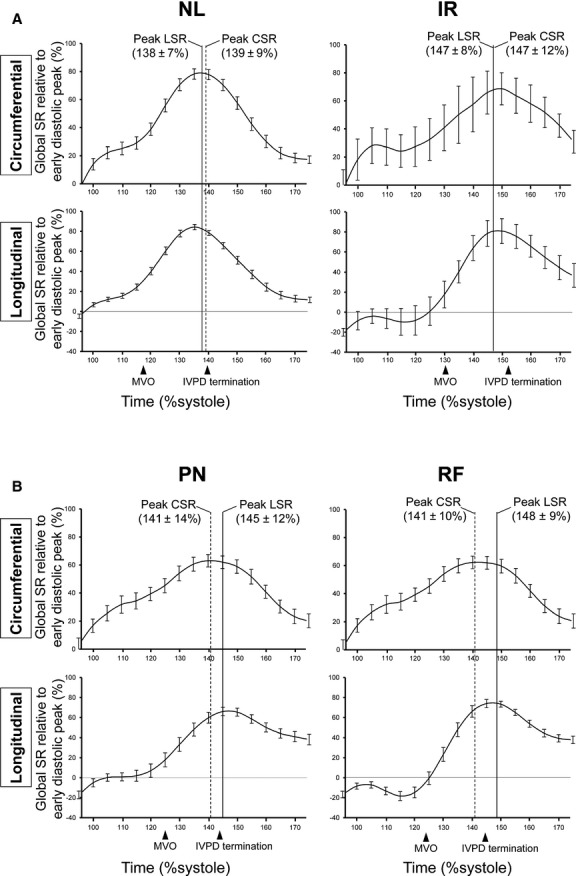
Group‐averaged global SR curves with standard errors are presented. Because the absolute values of SR are varied among the patients, the global SR was expressed as a percentage relative to the patient's early diastolic peak of global SR. This relative global SR was averaged at every 5% of the %systole in each diastolic grade. LSR, global longitudinal strain rate; CSR, global circumferential strain rate. Other abbreviations are the same as Figures 2, 4.