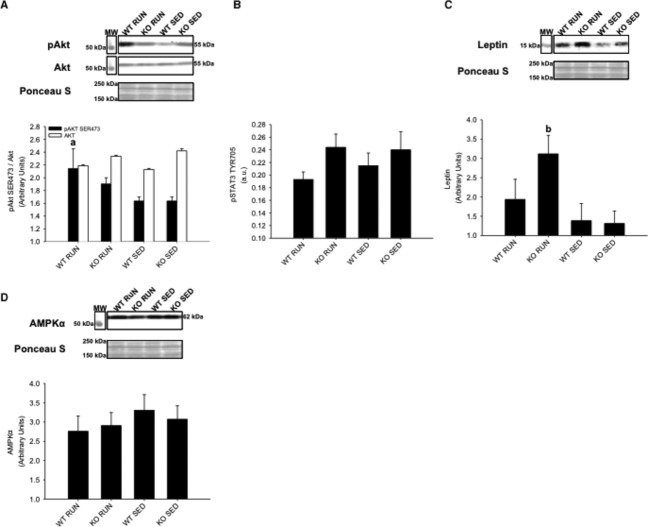
Figure 8.
Gastrocnemius and plantaris skeletal muscle protein expression of Akt, STAT3, leptin, and AMPKα from wild‐type (WT) and IL‐6 knockout (KO) groups with (RUN) and without (SED) voluntary access to running wheels fed a high‐fat diet for 4 weeks. Insulin‐stimulated (A) AktSER473 phosphorylation (B) STAT3TYR706 phosphorylation (C) Leptin expression (D) AMPKα expression. aDenotes significant differences (P ≤ 0.05) between WT RUN and WT SED groups. bDenotes significant differences (P ≤ 0.05) between KO RUN and KO SED groups. Data are presented as mean ± SEM, (n = 6–8 per group). Ponceau S stains are shown as markers of equal protein loading.

