
Figure 1.
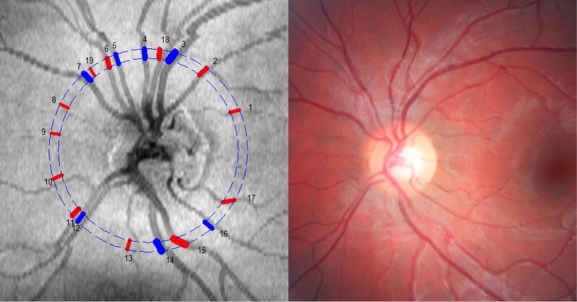
Left: Fundus image from Doppler FD‐OCT instrument for participant #9. The numbers indicate vessel location and the colors represent arterioles (red) or venules (blue). Right: Corresponding color fundus image for participant #9.
Official websites use .gov
A
.gov website belongs to an official
government organization in the United States.
Secure .gov websites use HTTPS
A lock (
) or https:// means you've safely
connected to the .gov website. Share sensitive
information only on official, secure websites.
Left: Fundus image from Doppler FD‐OCT instrument for participant #9. The numbers indicate vessel location and the colors represent arterioles (red) or venules (blue). Right: Corresponding color fundus image for participant #9.