
Figure 2.
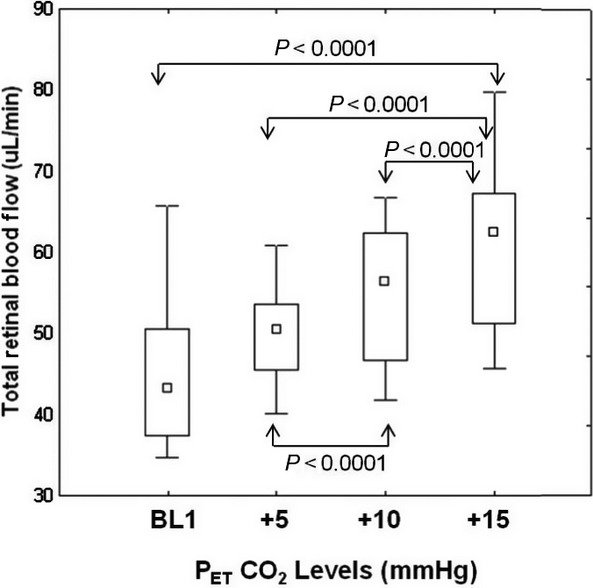
Comparisons of group total retinal blood flow relative to baseline (BL1) end‐tidal CO2 at three levels of increased CO2 (+5 to +15 mm Hg from BL1). Arrows above and below the boxes indicate significantly different pairs at P < 0.0001 level.