
Figure 3.
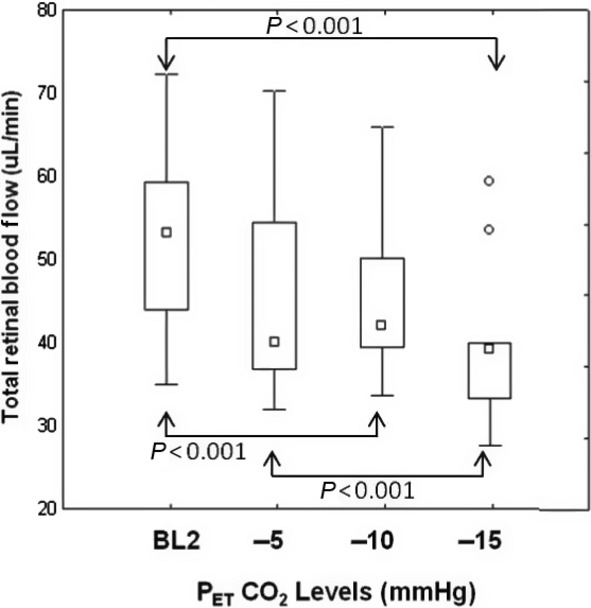
Comparisons of group total retinal blood flow relative to baseline (BL2) end‐tidal CO2 at three levels of decreased CO2 (−5 to −15 mmHg from BL2). The outliers are shown as individual round points. Arrows above and below the boxes indicate significantly different pairs at P < 0.001 level.