
Figure 1.
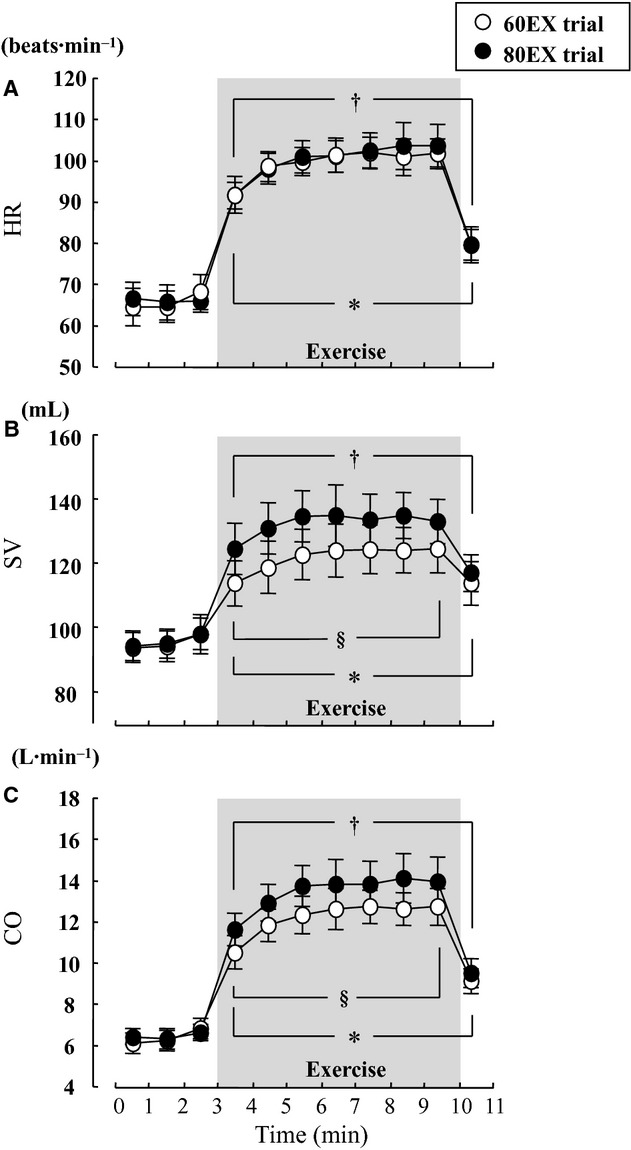
Changes in HR (A), SV (B), and CO (C) during the 60EX and 80EX trials. *P < 0.05 vs. the last minute of rest in the 60EX trial. †P < 0.05 vs. the last minute rest in the 80EX trial. §P < 0.05 when comparing the 60EX and 80EX trials.
Official websites use .gov
A
.gov website belongs to an official
government organization in the United States.
Secure .gov websites use HTTPS
A lock (
) or https:// means you've safely
connected to the .gov website. Share sensitive
information only on official, secure websites.
Changes in HR (A), SV (B), and CO (C) during the 60EX and 80EX trials. *P < 0.05 vs. the last minute of rest in the 60EX trial. †P < 0.05 vs. the last minute rest in the 80EX trial. §P < 0.05 when comparing the 60EX and 80EX trials.