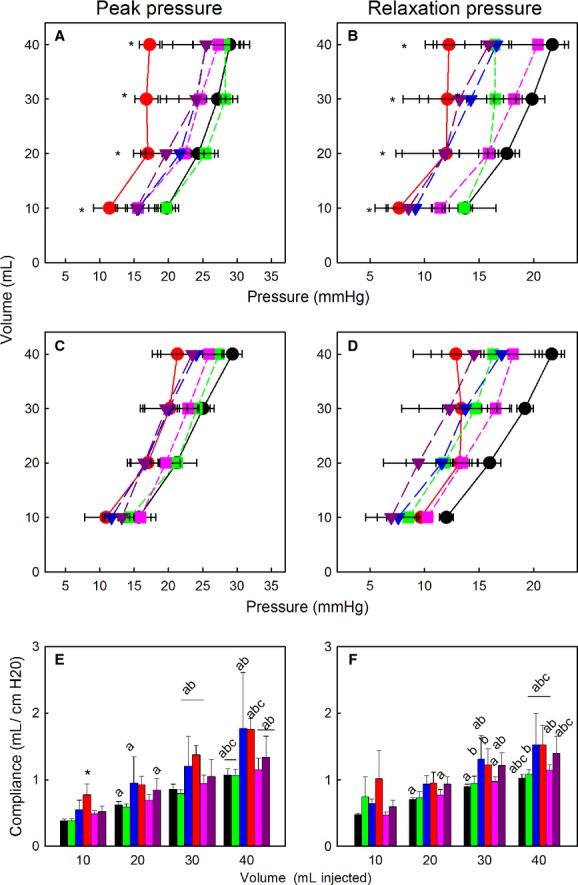
Figure 1.

(A–D) Volume–Pressure relationships in ovine fetal lung after treatment with Aldo (red circles and bars, n = 5), 0.25Beta (green squares and bars, n = 4), 0.75Beta (blue triangles and bars, n = 4), and Aldo/0.25Beta (pink squares and bars, n = 4), Aldo/0.75Beta (purple triangles and bars, n = 4), or control twins (black circles, n = 9). Panels A and C, peak pressure changes during first and second sets of inflations, respectively; Panels B and D, steady‐state relaxation pressures during first and second sets of inflations, respectively. *indicates pressure in aldosterone‐treated lungs different than control group at same volume, P < 0.05 Panels E–F, calculated compliance during inflation using peak pressure and injected volumes during the first (E) and second (F) sets of inflations. a, different than 10 mL; b, different from 20 mL; c, different from 30 mL during same series of inflations. *indicates different from control group at same volume. All data are expressed as mean ± SEM.
