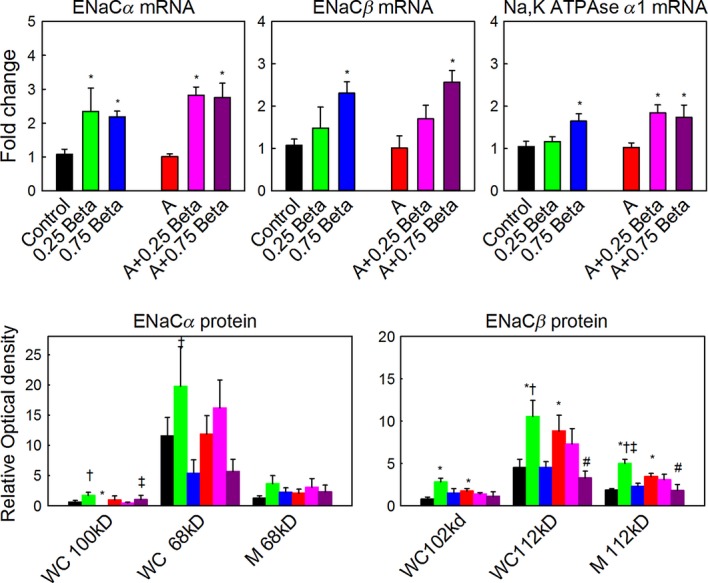
Figure 2.

Top panels: Relative fold changes in mRNA of ENaC‐α, ENaC‐β, and Na,K ATPase‐α1. Expression of mRNA is expressed as mean fold change in each group (indicated below each bar) relative to expression in the control group: black bars, betamethasone (Beta); green bars, 0.25Beta; blue bars, 0.75Beta; red bars, aldosterone (Aldo), pink bars, Aldo/0.25Beta; purple bars, Aldo/0.75Beta. Lower panels: Changes in ENaC‐α and ENaC‐β protein expression. Protein was quantified as optical density of bands with equal loading of membrane (M) and whole cell (WC) protein (70 μg); estimated molecular weights for each band that was quantified are indicated. Differences between groups for each measure are indicated: *different from control; #different from aldosterone alone; †differences between 0.25Beta and 0.75Beta treatment with the same aldosterone treatment; ‡difference between with aldosterone and without aldosterone treatment at same dose of betamethasone; P < 0.05. n's are as in Fig. 1.
