Figure 5.

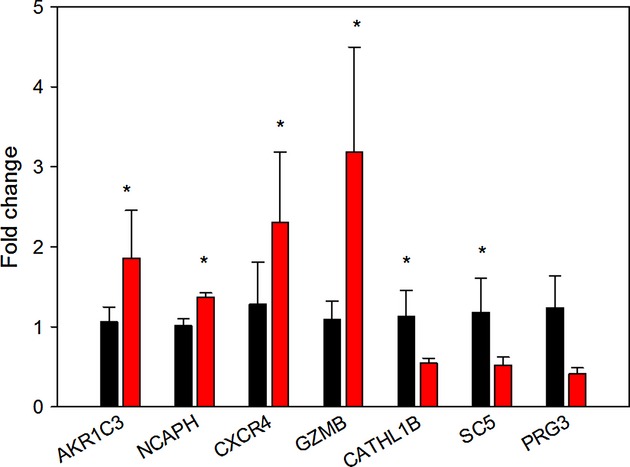
Fold changes in gene expression in four sets of twin pregnancies with one aldosterone‐treated fetus (red bars) relative to the mean values in the control twins (black). *difference between groups, P < 0.05.

Fold changes in gene expression in four sets of twin pregnancies with one aldosterone‐treated fetus (red bars) relative to the mean values in the control twins (black). *difference between groups, P < 0.05.