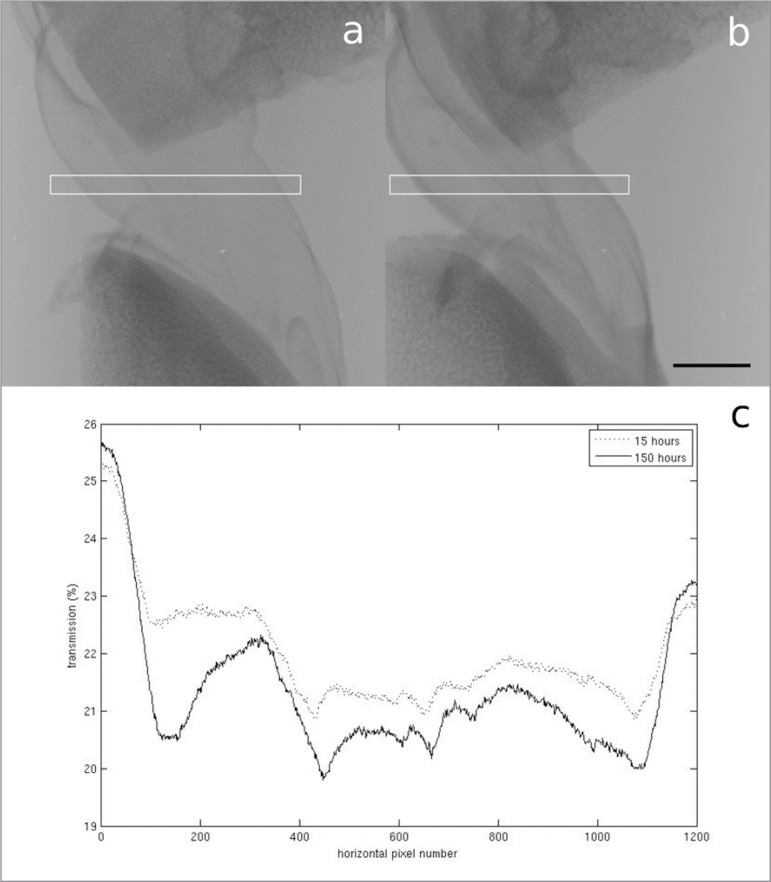
Figure 1 A–C.
A. Radiograph of the ACL stained with PTA for 15 hours. B. Radiograph of the ACL stained with PTA for 150 hours. Scale bar = 5 mm. The white boxes show the area the transmission profiles are plotted over. C. Plot of the transmission of X-rays through the centre of the ACL radiographs. The lower average transmission in the sample stained for 150 hours indicates a greater attenuation of X-rays.

