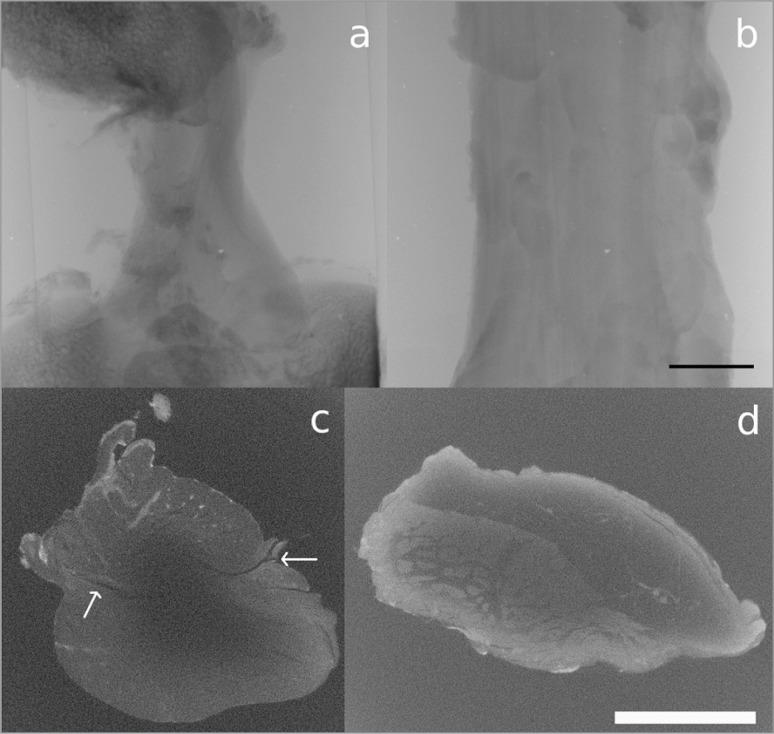
Figure 4 A–D.
A. Radiograph of the ACL, B. radiograph of the PT, C. imaged cross-sectional slice of the ACL, D. imaged cross-sectional slice of the PT, after 70 hours of IKI staining. Scale bars = 5 mm. The arrows in c. point to a dark band that may indicate the divide between the antero-medial and postero-lateral bundles of the ACL.

