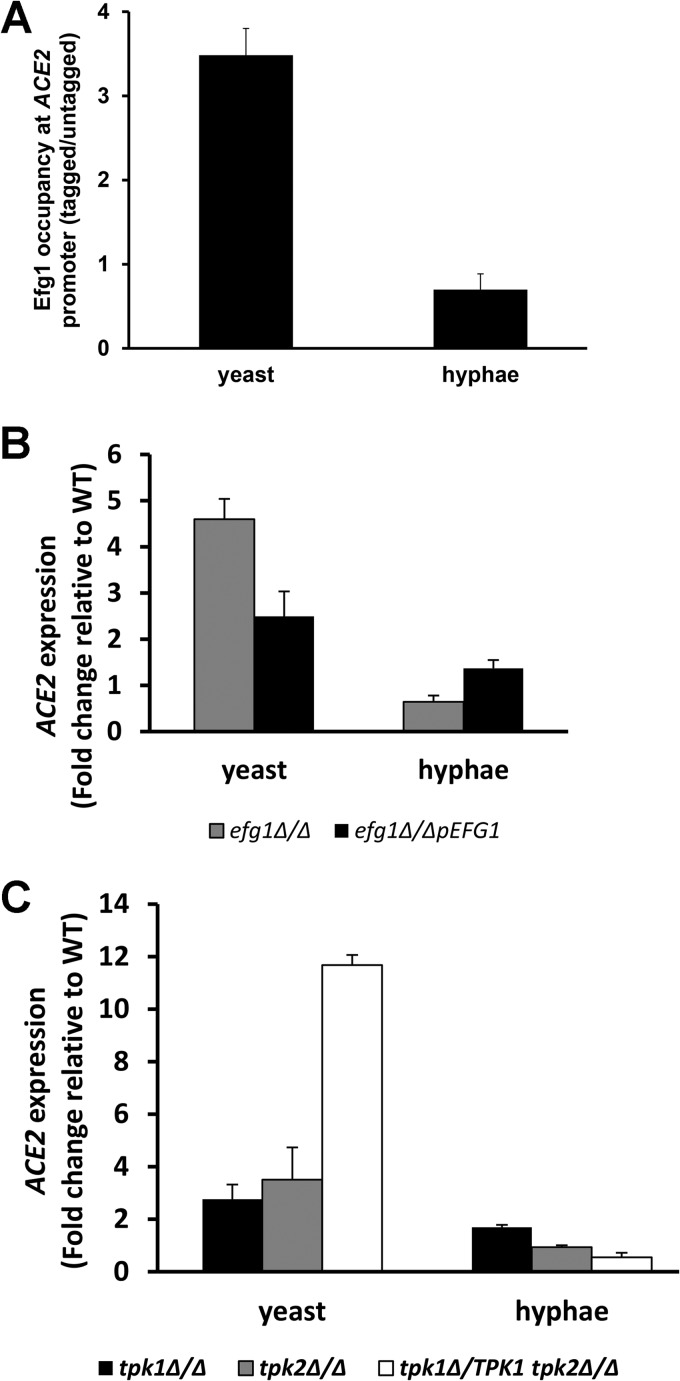
FIG 4.
Efg1 directly represses the expression of ACE2 in a manner dependent on the PKA kinases Tpk1 and Tpk2. (A) Chromatin immunoprecipitation with Efg1-Myc in yeast and hyphal cells. The presence of ACE2 in the precipitates was assayed by quantitative real-time PCR with primers spanning the consensus Efg1 binding sites. The bars represent the mean enrichment in tagged samples relative to that of untagged samples, and error bars indicate standard deviations from 3 biological replicates. (B and C) ACE2 expression was determined by RT-PCR for the indicated strains. Bars represent mean ACE2 expression in the mutant strain relative to that of the WT (fold change). Error bars represent standard deviations from 2 to 3 biological replicates assayed in triplicate. Yeast cells were from an overnight culture in YPD at 30°C (stationary phase), and hyphal cells were generated by shifting stationary-phase cells to Spider medium at 37°C for 3 h.

