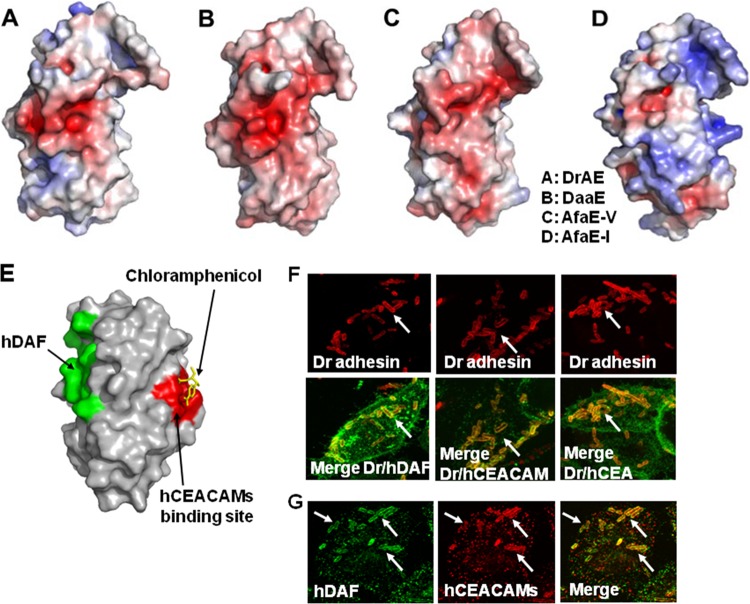
FIG 3.
Receptor clustering by Afa/Dr DAEC. (A to D) Representations of the DraE, DaaE, AfaE-V, and AfaE-I adhesin subunits, respectively. Surface electrostatic potentials of the DraE, DaaE, AfaE-V, and AfaE-I adhesins (red indicates the negative charges and blue the positive charges) are shown. (Reprinted from reference 157 with permission of the publisher.) (E) Representation of DraE adhesin subunit-associated surfaces allowing the specific recognition of hDAF or N-hCEA. Green, surface recognition of hDAF. Red, surface recognition of N-hCEA. Yellow, chloramphenicol bound onto the domain of AfaE-III that recognizes N-hCEA. (Reprinted from reference 160 with permission of the publisher.) (F) Micrographs showing the observation by confocal laser scanning microscopy (CLSM) of hDAF, hCEACAM1, and hCEA receptor clustering around Dr adhesin-positive E. coli adhering to untransfected HeLa cells constitutively expressing hDAF and to transfected HeLa cells expressing hCEACAM1 and hCEA. Yellow shows colocalization of immunolabeling of Dr adhesin (red) and hDAF, hCEACAM1, or hCEA (green). (Reprinted from reference 274 with permission of the publisher. Copyright 2004 Blackwell Publishing Ltd.) (G) Receptor clustering of hDAF (green) and hCEACAM1 (red) around Dr adhesin-positive E. coli adhering onto transfected HeLa cells expressing hCEACAM1. Yellow, colocalization of immunolabelings of hDAF and hCEACAM1. Arrows show immunolabelings of interest around adhering bacteria. (Reprinted from reference 274 with permission of the publisher. Copyright 2004 Blackwell Publishing Ltd.)

