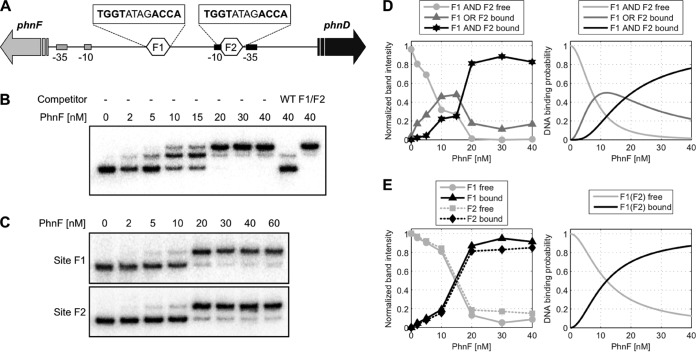
FIG 1.
Electrophoretic mobility shift assays with PhnF. Radiolabeled DNA containing the phnF-phnD intergenic region was incubated with various concentrations of PhnF, as indicated, followed by electrophoresis on a 6% acrylamide gel. (A) Schematic of target DNA region. The intergenic region between phnF and phnD is shown. The two PhnF target sites are indicated as hexagons labeled F1 and F2, and their sequences are given above. The −10/−35 promoter elements for phnF and phnD are indicated by gray and black rectangles, respectively. (B) Target DNA of wild-type sequence. Competitor DNA was 100 ng the unlabeled PCR product of the wild-type (WT) sequence (TGGTATAGACCA for both binding sites) or the same fragment carrying mutations in both PhnF binding sites (F1/F2; TGTGATAGACAC in site F1, TGGTATAGCACA in site F2 [the mutated sites are underlined]). (C) Target DNA of the same fragment used in the assay whose results are presented in panel B, but with only the phnF-proximal (site F1) or phnDCE-proximal (site F2) PhnF binding site being intact. (D) Quantification of experimental band intensities from the bands in panel B (left) and model prediction (right). To correct for variations in the total amount of DNA loaded per lane, the graph shows the experimental band intensities relative to the total intensity in each lane. The theoretical curves correspond to the probability of finding both F1 and F1 free (light gray), either F1 or F2 occupied (dark gray), and both sites occupied by a PhnF2 dimer (black). (E) Quantification of experimental band intensities from the bands in panel C (left) and model prediction (right). Normalization of the experimental band intensities was done as described in the legend to panel D. The theoretical curves show the DNA binding probability for binding of PhnF2 to F1, which is the same as that for binding to F2. The model parameters for panels D and E are Kd equal to 100 nM for the PhnF2 dimerization constant and equal to equal to 1 nM for the PhnF2-DNA binding constant.

