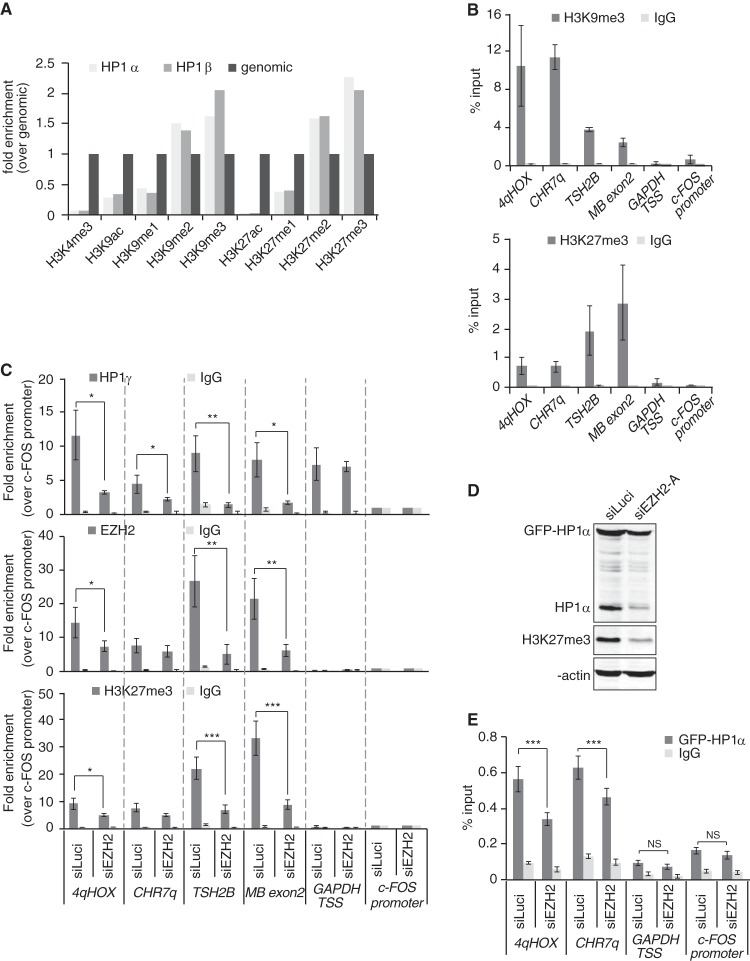
FIG 8.
EZH2 depletion induces loss of HP1γ from chromatin at H3K27me3-enriched loci. (A) Analysis of “Additional file 2” data from LeRoy et al. (9) The graph shows relative H3 or H4 posttranslational modification enrichment determined by quantitative mass spectrometry in chromatin samples immunoprecipitated with FLAG antibodies and obtained from HEK293 cells expressing either FLAG-HP1α or FLAG-HP1β. Data were normalized to genomic levels of these marks. (B) qPCR analysis of ChIP DNA using primers specific for the indicated genomic regions. HT1080 chromatin was immunoprecipitated with antibodies against H3K9me3 or H3K27me3. Nonspecific total rabbit IgGs were used as a control. Genomic regions for qPCR analysis were chosen on the basis of the presence of H3K9me3 and H3K27me3. For heterochromatic/transcriptionally silent loci, we used primers amplifying the subtelomeric region of the D4Z4 repeat sequences on chromosome 4q (4qHOX), the chromosome 7 subtelomeric region, ∼200 bp away from the telomeric TTAGGG repeats (CHR7q), the promoter region of testis-specific histone 2B variant (TSH2B), and the exon 2 of myoglobin gene (MB exon2). The GAPDH TSS (transcription start site) region, extending from −46 to +119 relative to the TSS, was chosen as a locus positive for HP1γ binding but negative for H3K9me3, H3K27me3, and EZH2. The c-FOS promoter region was chosen as a negative control for all heterochromatic proteins. Data are shown as percent enrichment relative to input. (C) HT1080 cells were treated for 72 h with siRNA against EZH2 (siEZH2-A) or luciferase (siLuci), and chromatin was used for immunoprecipitation with specific antibodies against HP1γ (top panel), EZH2 (middle panel), H3K27me3 (bottom panel), or a nonspecific total rabbit IgG. Data are shown as enrichment over the negative control (the c-FOS promoter region). Quantifications were obtained from three independent experiments (n = 3). *, P < 0.05; **, P < 0.01; ***, P < 0.005. (D) HT1080 cells stably expressing GFP-HP1α protein were treated for 4 days with siEZH2-A or siLuci and reductions in either endogenous or GFP-tagged HP1α levels were monitored by Western blotting. H3K27me3 levels are shown as an indication of EZH2 knockdown and β-actin as a loading control. (E) qPCR analysis of ChIP samples using chromatin samples from panel D. ChIP was carried out with antibodies against GFP or nonspecific total rabbit IgG. Data are shown as percent enrichment relative to input. Quantifications were obtained from three independent experiments (n = 3). ***, P < 0.005; NS, not significant.

