
FIG 2.
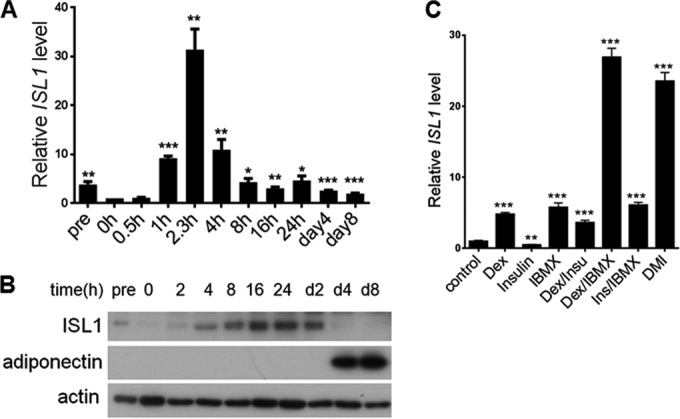
ISL1 expression during 3T3-L1 cell differentiation. (A and B) ISL1 mRNA and protein levels at the indicated time points during adipogenesis. (A) Total RNA was isolated from 3T3-L1 cells. Gene expression of ISL1 was measured by quantitative real-time RT-PCR. Expression levels at day 0 are indicated as 1. Error bars indicate SEM of data from three independent experiments, with each experiment being performed in triplicate. pre indicates preconfluent 3T3-L1 cells. (B) Nuclear fractions of 3T3-L1 cells were subjected to SDS-PAGE, and ISL1 and adiponectin were detected by immunoblotting. Actin served as a loading control. (C) ISL1 mRNA levels in response to different treatments. Total RNA was isolated from 3T3-L1 cells treated under different conditions, as indicated, and measured by quantitative real-time RT-PCR.