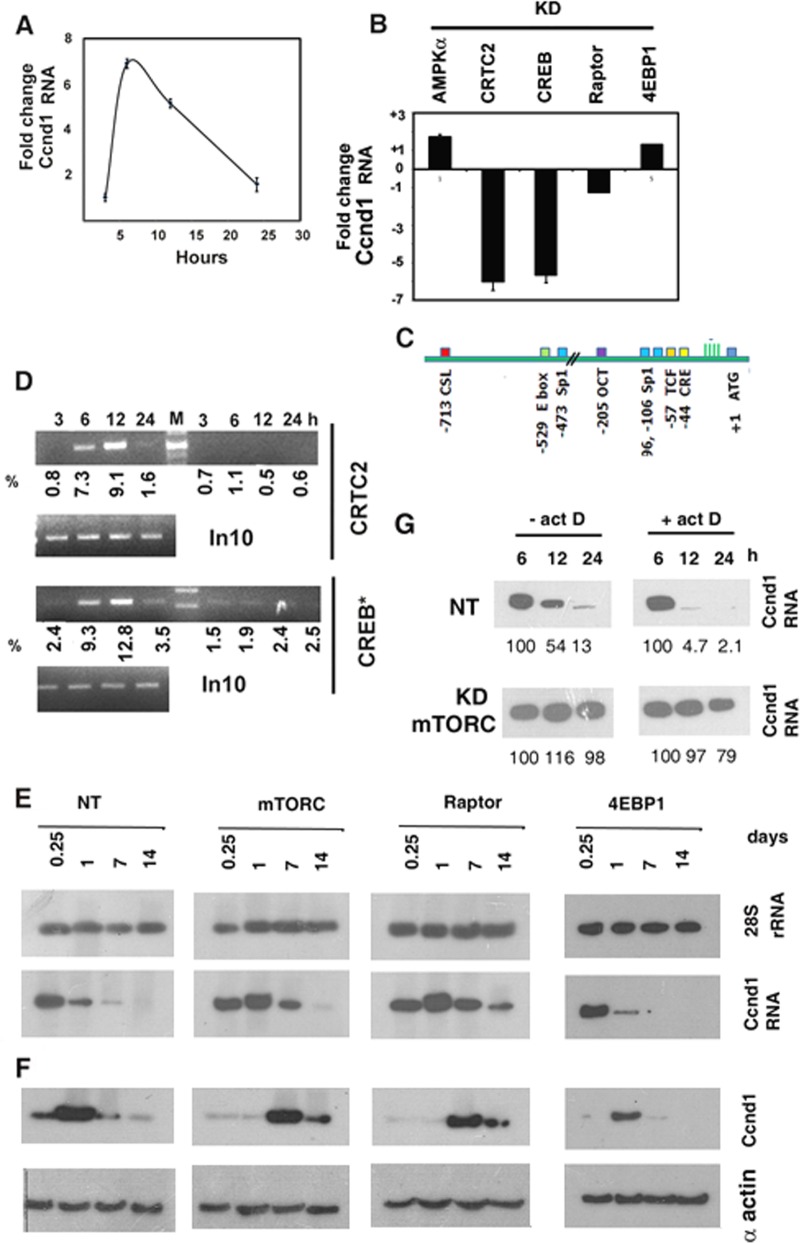
FIG 5.
Regulation of cyclin D1 expression during regeneration. (A) Q PCR analysis of CcnD1 RNA in injured muscle treated with pcRNA1-3 for the indicated times, showing fold changes with respect to the corresponding controls treated with D arm RNA. (B) Injured rat quadriceps muscle was infected with lentivirus targeting the specified mRNA and then treated with pcRNA1-3 for 6 h. Bars represent the fold changes of Ccnd1 transcripts measured by Q PCR in pcRNA-treated muscle knocked down at the specified locus versus nontargeted-shRNA-expressing control. (C) Map of transcription factor binding sites in the 5′ upstream region of the rat Ccnd1 gene. Numbers indicate distances in base pairs from the ATG codon. (D) ChIP signals from mononuclear cells in injured muscle treated with pcRNA1-3 for the indicated times using antibody against the specified protein and amplified using Ccnd1 promoter primers and 10% of PCR product visualized by gel electrophoresis. In10, PCR product from 10% of input DNA. Numbers indicate the percent recovery from SYBR Green Q-PCR data. (E, F) Ccnd1 mRNA (E) or protein (F) levels in control (NT) or KD muscle at various times following pcRNA treatment. (G) Northern blot analysis of Ccnd1 mRNA in NT or mTORC-KD regenerating muscle in the absence or presence of actinomycin D added at 6 h following pcRNA treatment.

