FIG 4.
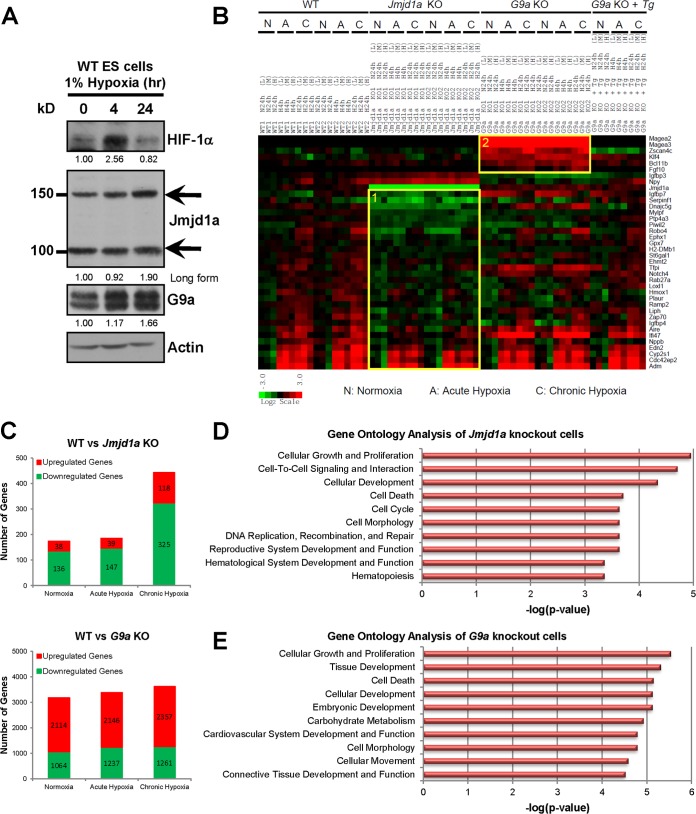
Identification of Jmjd1a- and G9a-dependent hypoxia transcriptomes in wild-type (WT1 and WT2), Jmjd1a knockout (Jmjd1a KO1 and KO2), G9a knockout (G9a KO1 and KO2), and G9a reconstituted (G9a KO + Tg) ES cells. (A) Hypoxia induces both Jmjd1a and G9a protein levels in mouse ES cells. Western blots show protein extracts of wild-type ES cells cultured in normoxia (21% O2), acute hypoxia (1% O2, 4 h), or chronic hypoxia (1% O2, 24 h) after probing with antibodies as indicated. The upper (150-kDa) and lower (100-kDa) bands for Jmjd1a correspond to long (Ensembl protein ID ENSMUSP00000065716) and short (Ensembl protein ID ENSMUSP00000098862) isoforms, respectively. HIF-1α was used as a positive control for hypoxic induction, and actin was used as a loading control. Band intensities were quantified, and their respective fold changes over the normoxia values of each protein are indicated. (B) Fold changes in gene expression over the average of the WT normoxic controls are as indicated on the scale bar with red for upregulation and green for downregulation. Gene categories 1 and 2 are highlighted in boxes. (C) Number of genes differentially expressed in Jmjd1a- and G9a-deficient cells >1.5-fold over control WT cells. (D and E) Gene ontology classification of genes differentially expressed at least 1.5-fold in Jmjd1a and G9a knockout ES cells compared to the wild-type control. The top ten most significant functional categories in the Jmjd1a knockout (D) and G9a knockout (E) cells were identified using Ingenuity Pathway Analysis. Significant associations with the functional categories were identified using Fisher's exact test at a P value cutoff of 0.05.

