FIG 8.
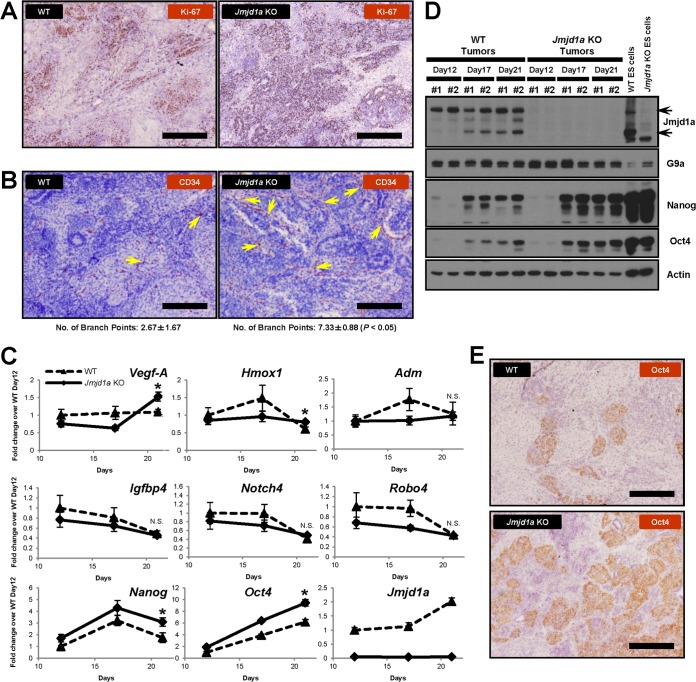
Loss of Jmjd1a increases microvessels and immature cell populations in tumors. (A) Jmjd1a KO tumors contain more proliferative cells than do WT tumors, as indicated by anti-Ki-67 antibody staining (brown); scale bars, 200 μm. (B) Jmjd1a KO tumors show increased vascular density as indicated by immunohistological staining for the endothelial cell-specific marker CD34 (brown). Arrows indicate branch points within the microvessels; scale bars, 200 μm. The average number of branch points observed for each tumor section is given below the panels. (C) Q-PCR analysis of gene expression in time course experiments of tumor growth. Gene expression levels were normalized against Ywhaz and Ubc2 housekeeping genes, and fold change values were calculated as ratios against the WT day 12 tumors. Vegf-A, Hmox1, Nanog, and Oct4 genes were significantly upregulated at day 21 in Jmjd1a KO tumors, but no significant change was observed for Adm, Igfbp4, Notch4, and Robo4 (*, P < 0.05; N.S., not significant). (D) Nanog and Oct4 are maintained at high protein levels of expression in Jmjd1a KO tumors. Western blots show WT and Jmjd1a KO tumors; #1 and #2 on each lane represent independent tumor samples. (E) Enhanced expression of Oct4 (brown) in Jmjd1a KO tumors, indicating increased abundance of immature stem cell-like populations. Scale bars, 200 μm.

