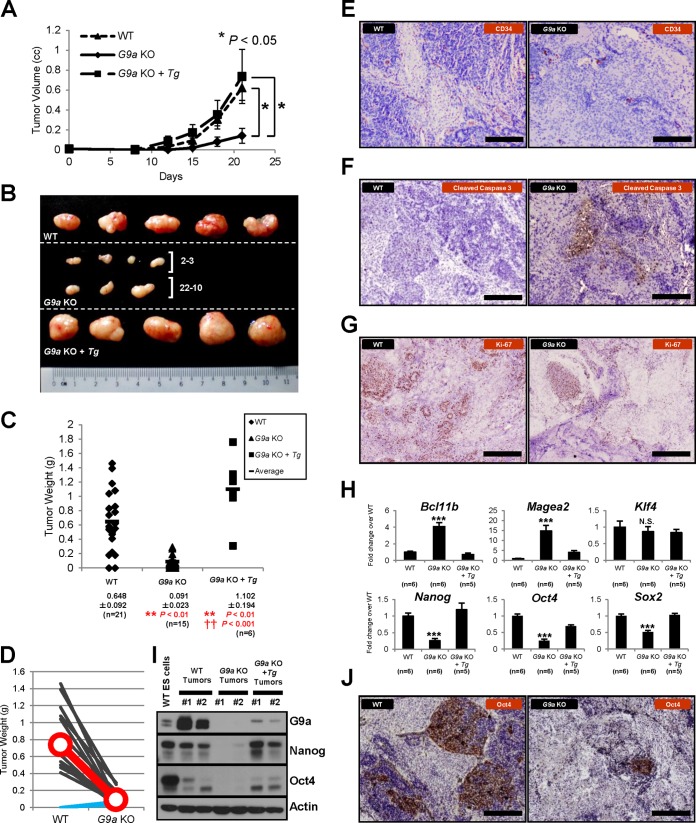
FIG 9.
G9a acts positively to promote tumor formation. (A) Loss of G9a decreases the tumor growth rate. (B) Gross morphology of tumors resected from NOD-SCID mice 20 days after subcutaneous injections with WT, G9a KO, and reconstituted G9a KO ES cells (G9a KO + Tg). 2-3 and 22-10, tumors derived from two independent G9a KO ES cell lines. (C) Final tumor masses of WT, G9a KO, and reconstituted G9a KO ES cells. Tumors were resected after 20 days of growth. **, P < 0.01 for comparisons versus WT; ††, P < 0.001 for the reconstituted G9a KO versus the G9a KO tumors. (D) G9a KO ES cells produce smaller tumors than those derived from wild-type cells. Comparison of tumor weights for wild-type and G9a KO cells injected into different dorsal sites within the same mouse (n = 14). Line graphs indicate the decrease in tumor size for G9a KO ES cell injections; exceptions showing increased tumor sizes are in blue. (E) G9a KO tumors have fewer microvessels compared to WT tumors as indicated by anti-CD34 staining (brown). Scale bars, 200 μm. (F) There is increased induction of apoptosis in G9a KO tumors as indicated by immunohistochemical staining for the apoptosis marker cleaved caspase-3 (brown). Scale bars, 200 μm. (G) G9a KO tumors contain fewer proliferating cells as indicated by anti-Ki-67 staining (brown). Scale bars, 200 μm. (H) Q-PCR analysis of tumor samples harvested at 21 days postinjection for target gene expression. Gene expression levels were normalized against the Ywhaz housekeeping gene, and fold change values were calculated against the WT tumors. (I) Protein levels of Nanog and Oct4 were downregulated in G9a KO tumors. #1 and #2, independent biological replicates of tumor protein extracts. (J) Oct4 expression was greatly reduced in G9a KO tumors as indicated by anti-Oct4 staining (brown). Scale bars, 200 μm.

