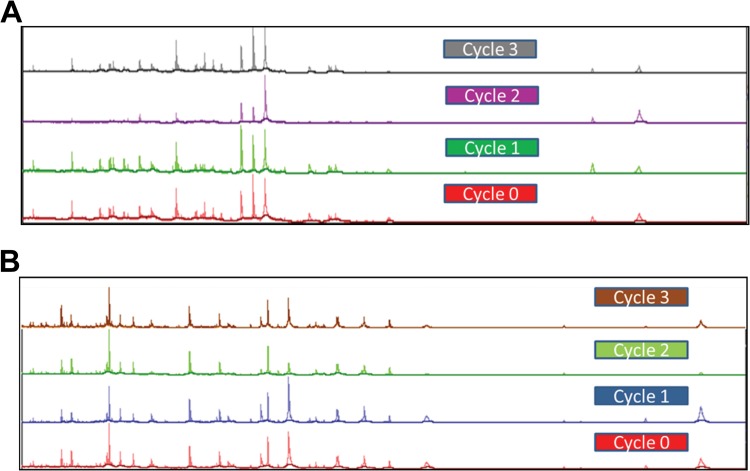
FIG 3.
Vitek MS spectra obtained from M. tuberculosis ATCC 25177 (A) and M. kansasii ATCC 12478 (B). The organisms were grown to log phase, and inactivation and extraction were performed. Aliquots from the protein extract were stored at −70°C and then subjected to three freeze-thaw cycles at a minimum of 24 h apart. The samples were analyzed after each thaw. The numbers of peaks obtained for M. tuberculosis were 116, 112, 87, and 108 at 0 (fresh sample prior to freeze), 1, 2, and 3 cycles, respectively. The numbers of peaks for M. kansasii were 120, 128, 108, and 121 at 0, 1, 2, and 3 cycles, respectively.

