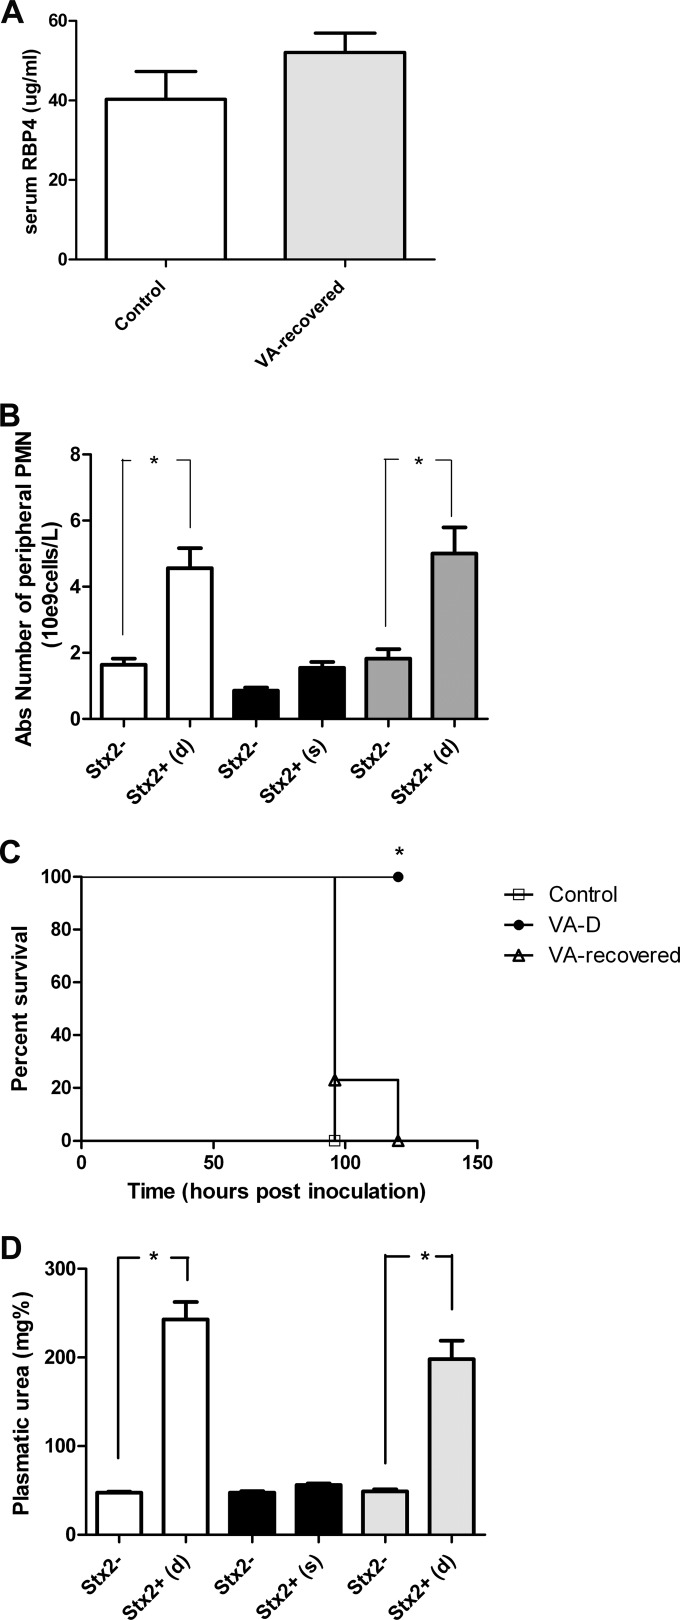
FIG 7.
Reversibility of VA deficiency. (A) RBP4 concentrations in the serum (μg/ml) of control (white bar) and VA-recovered (gray bar) mice were measured. The values shown are means ± the standard errors (five mice per experimental group were used). No significant differences in RBP4 concentrations were detected. The experiment was performed twice with similar results. (B) Control (white bars), VA-D (black bars), and VA-recovered (gray) mice were bled 96 h after i.v. inoculation with 1 LD100 of Stx2 (six mice per experi- mental group), and the absolute (Abs) number of PMNs in blood was evaluated. Mice were classified retrospectively according to their evaluation as survivors (s) or dead (d). All data were analyzed by ANOVA and a posteriori Tukey test. *, P < 0.05. Four non-Stx2-inoculated mice per control, VA-D, or VA-recovered group were used. The experiment was performed three times with similar results. (C) The survival of control (white squares), VA-D (black circles), and VA-recovered (black triangles) mice was monitored daily after the i.v. administration of 1 LD100 of Stx2 (six mice per experimental group were used). *, P < 0.05 (log rank test comparing VA-D and VA-recovered mice). The experiment was performed twice with similar results. (D) Control (white bars), VA-D (black bars), and VA-recovered (gray bars) mice were bled 96 h after i.v. inoculation with Stx2, and the urea concentrations in their plasma were evaluated. The values shown are mean concentrations (mg%) ± the standard errors. All data were analyzed by ANOVA and a posteriori Tukey test. *, P < 0.05. Six Stx2-inoculated and five non-Stx2-inoculated mice per control, VA-D, or VA-recovered group were used. The experiment was performed twice with similar results.

