
FIG 2.
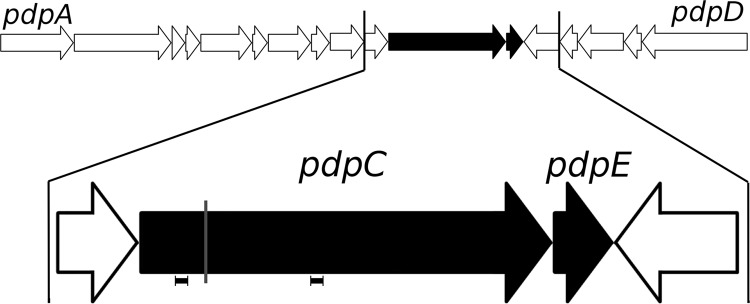
Map of the FPI region of F. tularensis. The pdpC and pdpE genes (black arrows) and the two adjacent genes are magnified. The location of the spontaneous mutation in the pdpC gene in FSC043 is indicated by a gray line. The locations of the primers used for RT-qPCR analysis are indicated by horizontal bars. The arrows indicate the direction of transcription.