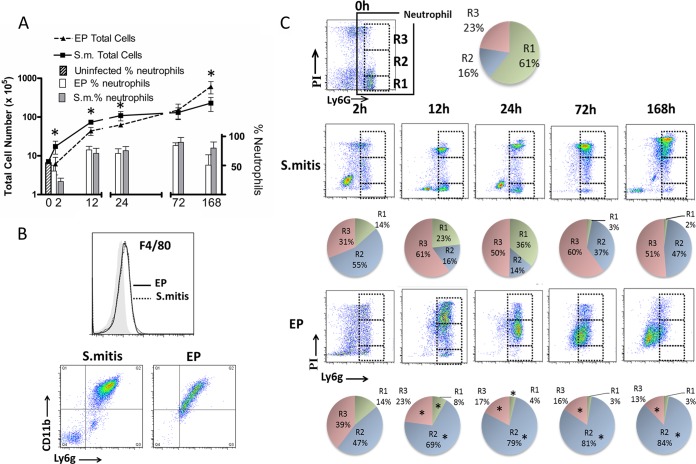
FIG 3.
Cellular infiltrates in EP-infected and S. mitis-infected chambers are distinct. (A) Total infiltrating cell numbers (left axis, points) and percent neutrophils (right axis, bars) in chambers infected with S. mitis (S.m.) or EP as indicated; 0 h represents uninfected chambers. *, P < 0.05 for EP compared to S. mitis, by t test. (B) Top panel, representative histogram of F4/80 staining of 7-day cells (black or dotted line) compared to isotype control (shaded histogram). Bottom panels, representative CD11b Ly6G double staining of 7-day chamber cells. Monocytes (CD11b+ Ly6g−, Q1) are absent in both populations. (C) PI/Ly6G staining of chamber cells from uninfected (0 h) S. mitis (top row)- and EP (bottom row)-infected chambers. Cells from chambers were collected at different times as indicated and analyzed by FACS for Ly6G and PI staining as described in Materials and Methods. Dashed boxes represent the R1, R2, and R3 gates as shown for the 0-h sample. Quantification of the percent neutrophils in the different populations (n = 5) is depicted by the pie charts below each dot plot. *, P < 0.001 by one-way ANOVA with Bonferroni's multiple-comparison test comparing each population from EP-infected chambers with that from S. mitis-infected chambers.

