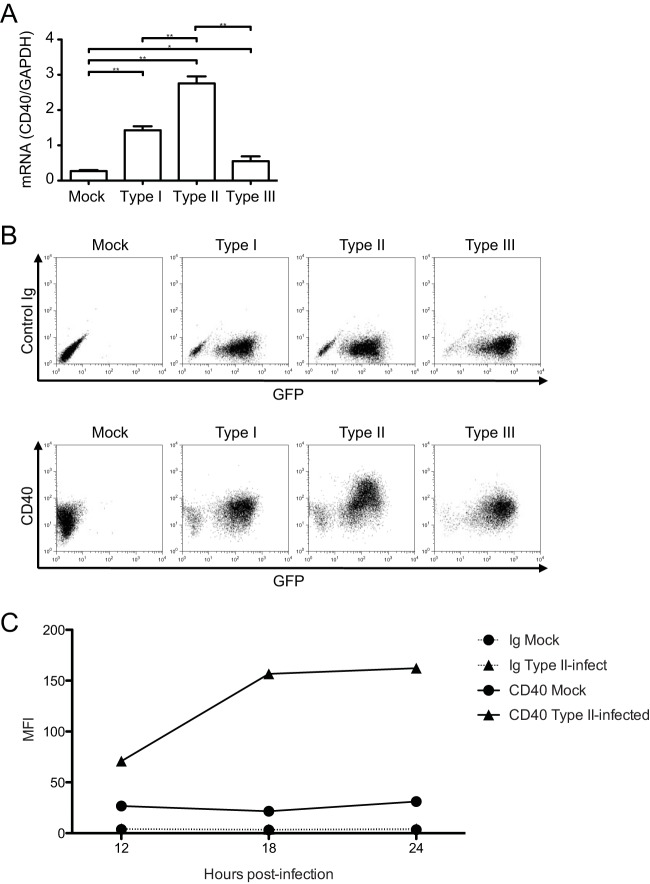
FIG 1.
Expression of CD40 during T. gondii infection. (A) BMdMs were mock infected or infected with type I, II, or III T. gondii tachyzoites. RNA was harvested at 6 hpi for cDNA synthesis and analysis by qPCR for CD40 transcript levels. The level of expression of CD40 relative to that of GAPDH is shown for each condition. Error bars represent the standard deviations of technical triplicates. (B) BMdMs were mock infected or infected with GFP-expressing T. gondii, as described in the legend to panel A, harvested at 18 hpi, and stained with a control Ig or monoclonal antibodies against CD40. (C) BMdMs were mock infected or infected with type II T. gondii, harvested at 12, 18, or 24 hpi, and stained with control Ig or anti-CD40 monoclonal antibodies, and the mean fluorescence intensity (MFI) values for each sample were plotted. *, P < 0.05: **, P < 0.01 (Student's t test). For all three panels, one representative set from at least three independent experiments is shown.

