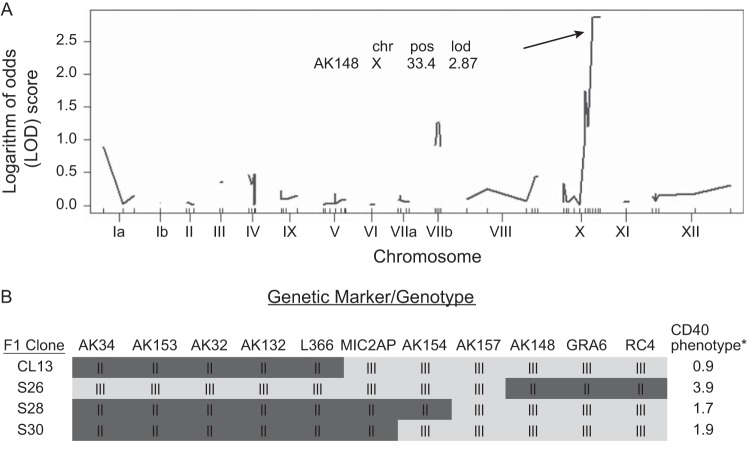
FIG 2.
QTL mapping of the CD40 induction phenotype. (A) QTL scan using raw data from BMdMs infected with 19 F1 progeny from a type II × type III cross. A nonsignificant logarithm of odds (LOD) peak was identified near marker AK148 (P = 0.145). The LOD score cutoff for genome-wide significance (P ≤ 0.05) was 4.50. chr X, chromosome X; pos, position (centiMorgan). (B) Genotypes and phenotypes of four F1 progeny used to further map the locus responsible for the CD40 induction phenotype. *, fold change in expression of T. gondii-infected cells compared with mock-infected cells.

