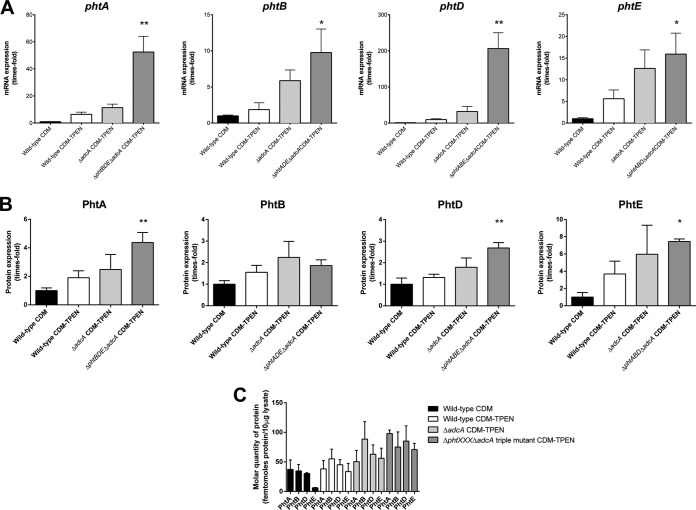
FIG 5.
Analysis of Pht expression levels in wild-type (white bars), ΔadcA (light gray bars), or ΔphtXXX (XXX represents three pht loci) ΔadcA (dark gray bars) strains grown in CDM-TPEN, compared to the wild-type strain grown in CDM (black bars). (A and B) mRNA (A) and protein (B) expression levels are shown, normalized to levels in the wild type grown in CDM. For mRNA, measurements were made relative to 16S rRNA. Error bars depict SEMs. Strains were compared to the wild type grown in CDM by one-way ANOVA using Dunnett's posttest, and statistically significant differences where present are indicated as follows: *, P < 0.05; **, P < 0.01. (C) Absolute protein expression levels of PhtA, PhtB, PhtD, and PhtE, expressed as femtomoles per 10 μg of bacterial lysate. Results are representative of three independent experiments.

