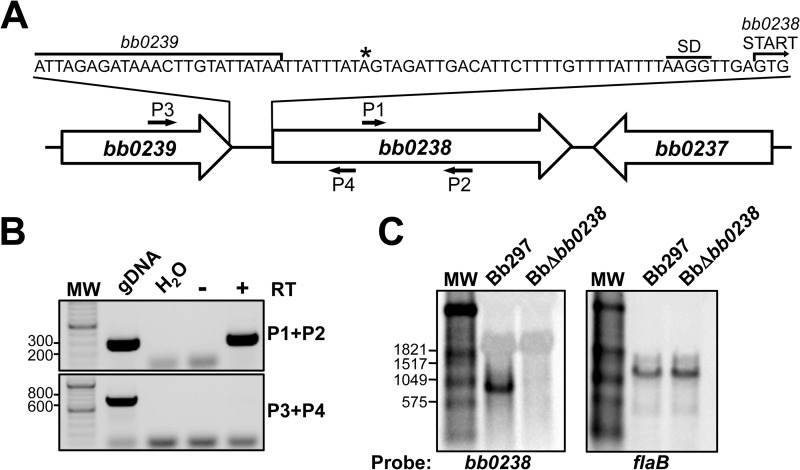
FIG 5.
Analysis of the bb0238 transcript. (A) Diagram illustrating bb0238 linkage primer sites and TSS mapped by 5′ RACE. The small arrows denote the relative positions of bb0238 diagnostic primers (P1 and P2) and bb0238-bb0239 linkage primers (P3 and P4). The asterisk denotes the TSS predicted by 5′ RACE. (B) RT-PCR results with the bb0238 internal control primers (P1 and P2) and linkage primers spanning the bb0238 and bb0239 intergenic region (P3 and P4). gDNA, Bb297 DNA; H2O, negative control for amplification; for Bb297 RNA, − and + designate the reactions prepared without and with reverse transcriptase (RT), respectively. DNA size standards (lane MW), indicated to the left of the panel, are shown in base pairs. (C) Northern blot analysis of Bb297 and BbΔbb0238 RNAs. The probes and transcripts detected are indicated beneath the gels. Relevant sizes of the DIG-labeled RNA standard (lanes MW) are shown on the left in base pairs.

