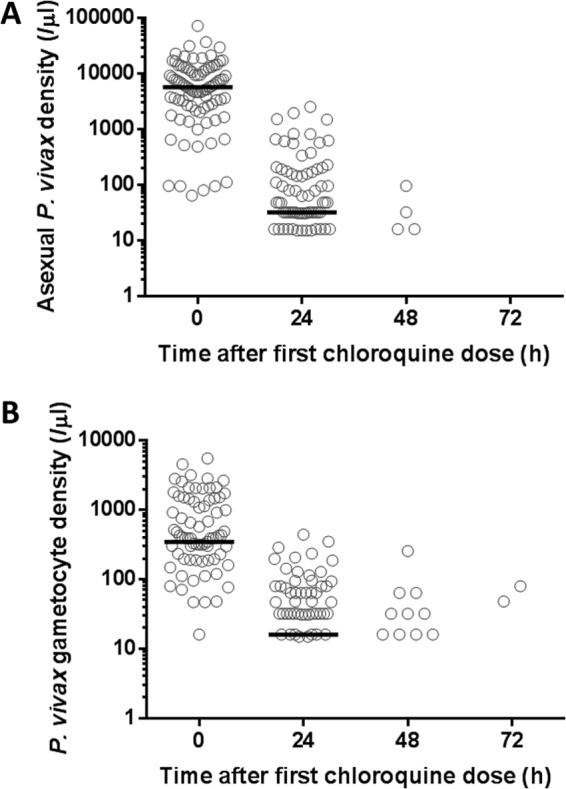
FIG 1.

Asexual parasite densities (A) and gametocyte densities (B) following chloroquine treatment at 0, 24, and 48 h. The median values are indicated by the horizontal black lines. (A) There are 18, 65, and 4 zero values at 24, 48, and 72 h, respectively, which are not shown on the logarithmic scale. (B) There are 36, 59, and 2 zero values at 24, 48, and 72 h, respectively, which are also not shown.
