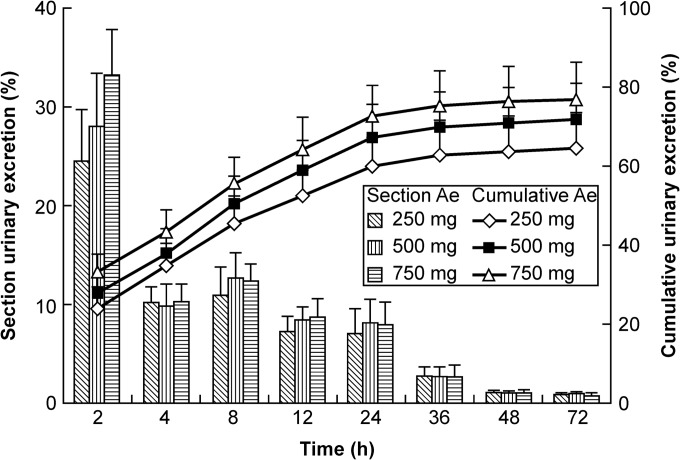
FIG 2.
Urinary excretion of nemonoxacin following single administration of 250 mg, 500 mg, or 750 mg i.v. nemonoxacin in healthy Chinese volunteers (mean ± SD; n = 12). Histogram and lines represent the section excretion rate (left y axis) and cumulative excretion rate (right y axis), respectively, of nemonoxacin.

