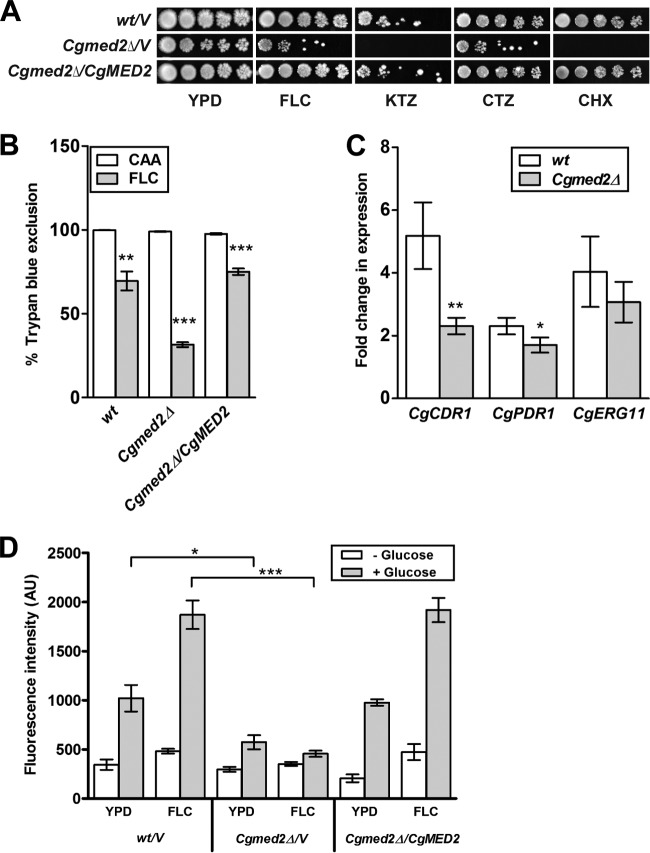
FIG 1.
The Cgmed2Δ mutant displays impaired activation of the CgCDR1 and CgPDR1 genes upon fluconazole exposure. (A) Spotting assays of the indicated C. glabrata strains. Cells were grown in YPD medium for 16 h, the OD600 was normalized to 1.0, and the cells were spotted in 10-fold serial dilutions on YPD agar plates supplemented or not with 8 μg/ml fluconazole (FLC), 10 μg/ml ketoconazole (KTZ), 15 μg/ml clotrimazole (CTZ), and 1.5 μg/ml cycloheximide (CHX). Plates were imaged after 1 to 2 days of incubation at 30°C. (B) Trypan blue assay-based cell viability enumeration. The indicated C. glabrata strains were grown in either CAA medium (CAA) or CAA medium containing 128 μg/ml fluconazole (FLC) for 24 h at 30°C. Cells were collected, washed with PBS, and stained with 0.4% trypan blue for 10 min. For each strain, a minimum of 300 cells (stained [dead] and unstained [viable]) were counted microscopically, and cell viability data (means of three to five independent analyses ± SEMs) were plotted as the percentage of trypan blue exclusion. Statistical significance was determined using Student's unpaired t test. The significance of the difference between untreated and fluconazole-treated cells is indicated. **, P ≤ 0.01; ***, P ≤ 0.001. (C) qPCR-based quantification of the indicated mRNA levels in wild-type and Cgmed2Δ cells after 4 h treatment with 16 μg/ml fluconazole. Data were normalized to the levels of CgGAPDH mRNA and represent the means ± SEMs of three independent experiments. Statistical significance was determined using Student's unpaired t test. The significance of the difference between fluconazole-treated wild-type and Cgmed2Δ cells is indicated. *, P ≤ 0.05; **, P ≤ 0.01. (D) Measurement of rhodamine 6G efflux in the indicated C. glabrata strains. Cells were grown to log phase in the absence or presence of 16 μg/ml fluconazole and incubated with rhodamine 6G (10 μM) and 2′-deoxyglucose (5 mM) for 2 h at 30°C, followed by a pulse with 2 mM glucose. After 20 min, rhodamine 6G fluorescence was measured at excitation and emission wavelengths of 529 and 553 nm, respectively. Each value represents the mean and standard deviation from at least three independent experiments. The significance of the difference between fluconazole-treated wild-type and Cgmed2Δ cells is indicated. *, P ≤ 0.05; ***, P ≤ 0.001. AU, arbitrary units.

