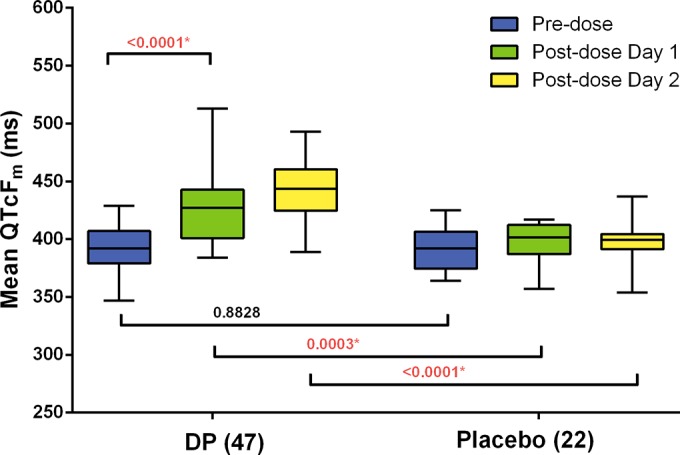
FIG 3.

Mean differences between predose QTcF intervals at baseline and at 4-h postdose intervals on days 1 and 2 of dosing during month 1 in the group that received dihydroartemisinin-piperaquine (DP) (n = 47) and the group that received placebo (n = 22). All volunteers who received at least one dose of study drug (n = 69) are shown. One subject whose treatment was halted after the first dose is not included in the postdose day 2 analysis. The center of each box represents the median, the top and bottom represent the 25th and 75th percentiles, the whiskers extend to either the lowest or highest value.
