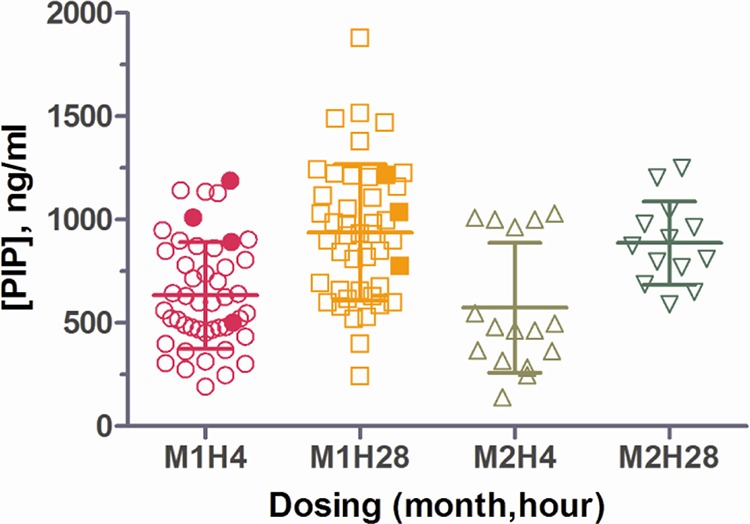
FIG 4.

Peak concentrations of piperaquine (PIP) in plasma at 4 and 28 h after the first dose each month. The time of the first dose is given as follows: the month (M) and hours after the first dose (H). Each symbol represents the value for an individual subject. The mean ± standard deviation (error bar) are shown for each group. The values for the treatment-halted subjects are shown by the solid symbols.
