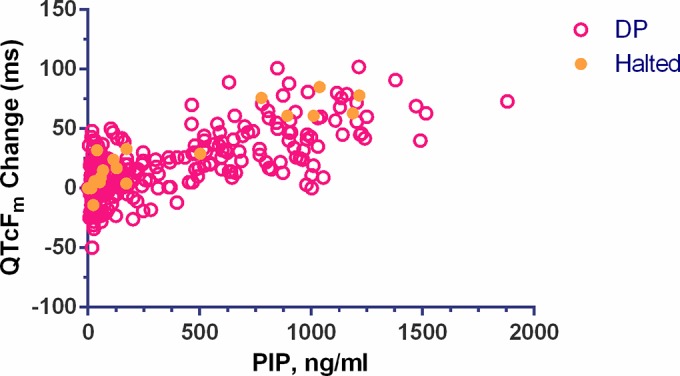
FIG 5.

Plot of the change in QTcFm from baseline versus plasma piperaquine concentration for subjects receiving dihydroartemisinin-piperaquine. The values for treatment-halted subjects are indicated by the solid orange circles. Spearman correlation analysis between concentration and QT interval prolongation was significant for subjects treated with dihydroartemisinin-piperaquine (n = 47; rho = 0.6706; P < 0.0001), with stronger correlation in the treatment-halted subjects (n = 4; rho = 0.8990; P < 0.0001).
