FIG 4.
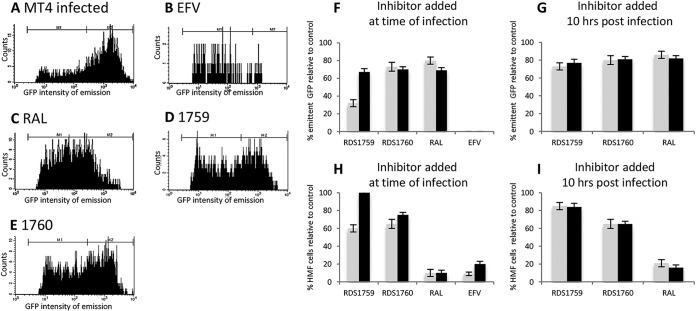
Inhibition of HIV-1 replication by DKAs. MT4 cells were infected with NLENG1-ES-IRES wt virus containing a GFP reporter system. (A to E) Samples were analyzed 48 h postinfection to quantify the amount of emitting GFP cells (eGFP) versus the GFP intensity of emission, categorized as low intensity (M1), indicating expression from unintegrated viral DNA, and high intensity (M2), indicating integrated viral DNA expressing GFP. (A) Infected MT4 cells. (B) MT4 cells treated with 100 nM EFV. (C) MT4 cells treated with 200 nM RAL. (D) MT4 cells treated with 10 μM RDS1759. (E) MT4 cells treated with 10 μM RDS1760. (F to I) Samples were analyzed 48 hours p.i. (gray) and 72 hours p.i. (black) to quantify the percentage of total (M1 and M2) emitting GFP cells (F and G) and the percentage of HMF (M2) (H and I) normalized to the percentage of the untreated control sample. Drugs (10 μM RDS1759, 10 μM RDS1760, 100 nM EFV, and 200 nM RAL) were added at the time of infection (F and H) or 10 h p.i. (G and I). The experiment was performed three times (error bars represent standard deviations).

